|
Download Data (XLS File) |
|
||||||||
|
||||||||
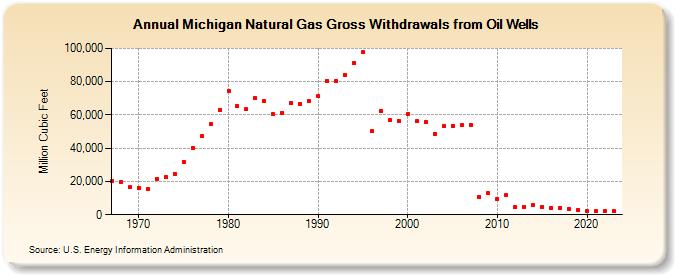
| Michigan Natural Gas Gross Withdrawals from Oil Wells (Million Cubic Feet) | ||||||||
| Decade | Year-0 | Year-1 | Year-2 | Year-3 | Year-4 | Year-5 | Year-6 | Year-7 | Year-8 | Year-9 |
|---|---|---|---|---|---|---|---|---|---|---|
| 1960's | 20,383 | 19,779 | 16,405 | |||||||
| 1970's | 16,264 | 15,482 | 21,730 | 22,424 | 24,719 | 31,994 | 40,003 | 47,189 | 54,318 | 62,812 |
| 1980's | 74,459 | 65,095 | 63,310 | 70,088 | 68,103 | 60,301 | 61,368 | 67,455 | 66,796 | 68,387 |
| 1990's | 71,126 | 80,565 | 80,192 | 84,119 | 91,332 | 97,547 | 50,281 | 62,323 | 56,748 | 56,606 |
| 2000's | 60,444 | 56,140 | 56,028 | 48,530 | 53,069 | 53,355 | 53,735 | 54,114 | 10,716 | 12,919 |
| 2010's | 9,453 | 11,620 | 4,470 | 4,912 | 5,560 | 4,813 | 4,258 | 4,262 | 3,487 | 2,870 |
| 2020's | 1,944 | 2,000 | 2,218 | 2,179 | 1,756 |
| - = No Data Reported; -- = Not Applicable; NA = Not Available; W = Withheld to avoid disclosure of individual company data. |
| Release Date: 6/30/2026 |
| Next Release Date: 7/31/2026 |