|
Download Data (XLS File) |
|
||||||||
|
||||||||
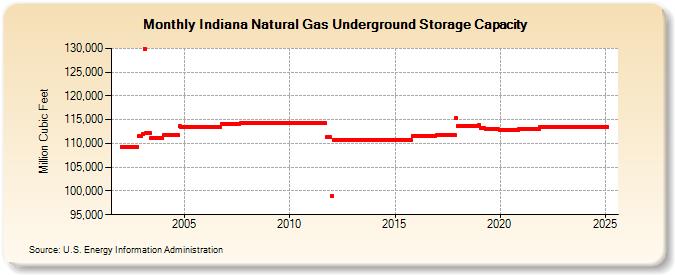
| Indiana Natural Gas Underground Storage Capacity (Million Cubic Feet) | ||||||||
| Year | Jan | Feb | Mar | Apr | May | Jun | Jul | Aug | Sep | Oct | Nov | Dec |
|---|---|---|---|---|---|---|---|---|---|---|---|---|
| 2002 | 109,310 | 109,310 | 109,310 | 109,310 | 109,310 | 109,310 | 109,310 | 109,310 | 109,310 | 109,310 | 111,556 | 111,556 |
| 2003 | 112,088 | 129,968 | 112,095 | 112,095 | 112,095 | 111,095 | 111,095 | 111,095 | 111,095 | 111,095 | 111,095 | 111,095 |
| 2004 | 111,680 | 111,680 | 111,680 | 111,680 | 111,680 | 111,680 | 111,680 | 111,680 | 111,680 | 113,597 | 113,397 | 113,397 |
| 2005 | 113,397 | 113,397 | 113,397 | 113,397 | 113,397 | 113,397 | 113,397 | 113,397 | 113,397 | 113,397 | 113,397 | 113,397 |
| 2006 | 113,397 | 113,397 | 113,397 | 113,397 | 113,397 | 113,397 | 113,397 | 113,397 | 113,397 | 114,080 | 114,080 | 114,080 |
| 2007 | 114,080 | 114,080 | 114,080 | 114,080 | 114,080 | 114,080 | 114,080 | 114,080 | 114,294 | 114,294 | 114,294 | 114,294 |
| 2008 | 114,294 | 114,294 | 114,294 | 114,294 | 114,294 | 114,294 | 114,294 | 114,294 | 114,294 | 114,294 | 114,294 | 114,294 |
| 2009 | 114,294 | 114,294 | 114,294 | 114,294 | 114,294 | 114,294 | 114,294 | 114,294 | 114,294 | 114,294 | 114,294 | 114,274 |
| 2010 | 114,274 | 114,274 | 114,274 | 114,274 | 114,274 | 114,274 | 114,274 | 114,274 | 114,274 | 114,274 | 114,274 | 114,274 |
| 2011 | 114,274 | 114,274 | 114,274 | 114,274 | 114,274 | 114,274 | 114,274 | 114,274 | 114,274 | 111,271 | 111,271 | 111,271 |
| 2012 | 98,869 | 110,749 | 110,749 | 110,749 | 110,749 | 110,749 | 110,749 | 110,749 | 110,749 | 110,749 | 110,749 | 110,749 |
| 2013 | 110,749 | 110,749 | 110,749 | 110,749 | 110,749 | 110,749 | 110,749 | 110,749 | 110,749 | 110,749 | 110,749 | 110,749 |
| 2014 | 110,749 | 110,749 | 110,749 | 110,749 | 110,749 | 110,749 | 110,749 | 110,749 | 110,749 | 110,749 | 110,749 | 110,749 |
| 2015 | 110,749 | 110,749 | 110,749 | 110,749 | 110,749 | 110,749 | 110,749 | 110,749 | 110,749 | 110,749 | 111,581 | 111,581 |
| 2016 | 111,581 | 111,581 | 111,581 | 111,581 | 111,581 | 111,581 | 111,581 | 111,581 | 111,581 | 111,581 | 111,581 | 111,581 |
| 2017 | 111,721 | 111,721 | 111,721 | 111,721 | 111,721 | 111,721 | 111,721 | 111,721 | 111,721 | 111,721 | 111,721 | 115,325 |
| 2018 | 113,665 | 113,659 | 113,659 | 113,659 | 113,659 | 113,659 | 113,659 | 113,659 | 113,659 | 113,659 | 113,659 | 113,761 |
| 2019 | 113,911 | 113,156 | 113,156 | 113,156 | 113,006 | 113,006 | 113,006 | 113,006 | 113,006 | 113,006 | 113,006 | 112,972 |
| 2020 | 112,909 | 112,909 | 112,909 | 112,909 | 112,909 | 112,909 | 112,909 | 112,909 | 112,909 | 112,909 | 112,909 | 112,987 |
| 2021 | 112,987 | 112,987 | 112,987 | 112,987 | 112,987 | 112,987 | 112,987 | 112,987 | 112,987 | 112,987 | 112,987 | 113,465 |
| 2022 | 113,465 | 113,465 | 113,465 | 113,465 | 113,465 | 113,465 | 113,465 | 113,465 | 113,465 | 113,465 | 113,465 | 113,537 |
| 2023 | 113,537 | 113,537 | 113,537 | 113,537 | 113,537 | 113,537 | 113,537 | 113,537 | 113,537 | 113,537 | 113,537 | 113,549 |
| 2024 | 113,549 | 113,549 | 113,549 | 113,549 | 113,549 | 113,549 | 113,549 | 113,549 | 113,549 | 113,549 | 113,549 | 113,549 |
| 2025 | 113,549 | 113,549 | 113,549 | 113,549 | 113,549 | 113,549 | 113,549 | 113,549 | 113,549 | 113,549 | 113,549 | 113,549 |
| 2026 | 113,549 | 113,549 | 113,549 | 113,549 | ||||||||
| - = No Data Reported; -- = Not Applicable; NA = Not Available; W = Withheld to avoid disclosure of individual company data. |
| Release Date: 6/30/2026 |
| Next Release Date: 7/31/2026 |