|
Download Data (XLS File) |
|
|||||
|
|||||
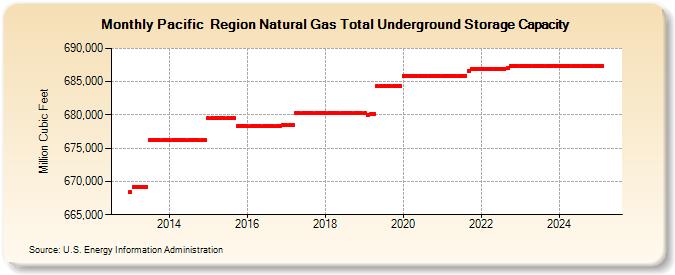
| Pacific Region Natural Gas Total Underground Storage Capacity (Million Cubic Feet) | |||||
| Year | Jan | Feb | Mar | Apr | May | Jun | Jul | Aug | Sep | Oct | Nov | Dec |
|---|---|---|---|---|---|---|---|---|---|---|---|---|
| 2013 | 668,361 | 669,176 | 669,176 | 669,176 | 669,176 | 669,176 | 676,176 | 676,176 | 676,176 | 676,176 | 676,176 | 676,176 |
| 2014 | 676,176 | 676,176 | 676,176 | 676,176 | 676,176 | 676,176 | 676,176 | 676,176 | 676,176 | 676,176 | 676,176 | 676,176 |
| 2015 | 679,477 | 679,477 | 679,477 | 679,477 | 679,477 | 679,477 | 679,477 | 679,477 | 679,477 | 678,273 | 678,273 | 678,273 |
| 2016 | 678,273 | 678,273 | 678,273 | 678,273 | 678,273 | 678,273 | 678,273 | 678,273 | 678,273 | 678,273 | 678,273 | 678,473 |
| 2017 | 678,473 | 678,473 | 678,473 | 680,273 | 680,273 | 680,273 | 680,273 | 680,273 | 680,273 | 680,273 | 680,273 | 680,273 |
| 2018 | 680,273 | 680,273 | 680,273 | 680,273 | 680,273 | 680,273 | 680,273 | 680,273 | 680,273 | 680,273 | 680,273 | 680,273 |
| 2019 | 680,273 | 679,948 | 680,156 | 680,156 | 684,332 | 684,332 | 684,332 | 684,332 | 684,332 | 684,332 | 684,332 | 684,332 |
| 2020 | 685,877 | 685,877 | 685,877 | 685,877 | 685,877 | 685,877 | 685,877 | 685,877 | 685,877 | 685,877 | 685,877 | 685,877 |
| 2021 | 685,877 | 685,877 | 685,877 | 685,877 | 685,877 | 685,877 | 685,877 | 685,877 | 686,623 | 686,965 | 686,975 | 686,975 |
| 2022 | 686,975 | 686,975 | 686,975 | 686,975 | 686,975 | 686,975 | 686,975 | 686,975 | 686,993 | 687,407 | 687,407 | 687,407 |
| 2023 | 687,407 | 687,407 | 687,407 | 687,407 | 687,407 | 687,407 | 687,407 | 687,407 | 687,407 | 687,407 | 687,407 | 687,407 |
| 2024 | 687,407 | 687,407 | 687,407 | 687,407 | 687,407 | 687,407 | 687,407 | 687,407 | 687,407 | 687,407 | 687,407 | 687,407 |
| 2025 | 687,407 | 687,407 | 687,407 | 687,407 | 687,407 | 687,407 | 687,407 | 687,407 | 687,407 | 687,407 | 687,407 | 687,407 |
| 2026 | 687,407 | 687,407 | 687,407 | 687,407 | ||||||||
| - = No Data Reported; -- = Not Applicable; NA = Not Available; W = Withheld to avoid disclosure of individual company data. |
| Release Date: 6/30/2026 |
| Next Release Date: 7/31/2026 |