|
Download Data (XLS File) |
|
|||||
|
|||||
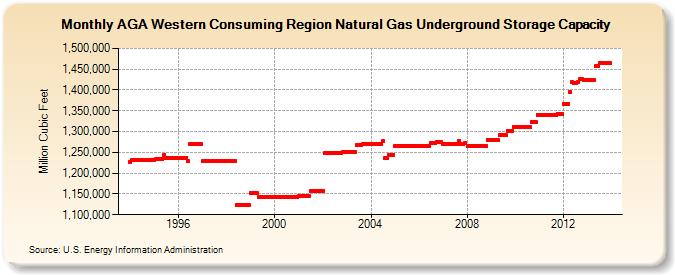
| AGA Western Consuming Region Natural Gas Underground Storage Capacity (Million Cubic Feet) | |||||
| Year | Jan | Feb | Mar | Apr | May | Jun | Jul | Aug | Sep | Oct | Nov | Dec |
|---|---|---|---|---|---|---|---|---|---|---|---|---|
| 1994 | 1,226,103 | 1,232,392 | 1,232,392 | 1,232,392 | 1,232,392 | 1,232,392 | 1,232,392 | 1,232,392 | 1,232,392 | 1,232,392 | 1,232,392 | 1,232,392 |
| 1995 | 1,232,392 | 1,233,637 | 1,233,637 | 1,233,637 | 1,233,637 | 1,243,137 | 1,237,446 | 1,237,446 | 1,237,446 | 1,237,446 | 1,237,446 | 1,237,446 |
| 1996 | 1,237,446 | 1,237,446 | 1,237,446 | 1,237,446 | 1,237,446 | 1,228,208 | 1,270,505 | 1,270,505 | 1,270,505 | 1,270,505 | 1,270,505 | 1,270,505 |
| 1997 | 1,228,395 | 1,228,395 | 1,228,076 | 1,228,076 | 1,228,076 | 1,228,076 | 1,228,076 | 1,228,076 | 1,228,076 | 1,228,076 | 1,228,076 | 1,228,076 |
| 1998 | 1,228,076 | 1,228,076 | 1,228,076 | 1,228,076 | 1,228,076 | 1,122,586 | 1,122,586 | 1,122,586 | 1,122,586 | 1,122,586 | 1,122,586 | 1,122,586 |
| 1999 | 1,151,311 | 1,151,311 | 1,151,311 | 1,151,311 | 1,143,251 | 1,143,251 | 1,143,251 | 1,143,251 | 1,143,251 | 1,143,251 | 1,143,251 | 1,143,251 |
| 2000 | 1,143,251 | 1,143,251 | 1,143,251 | 1,143,251 | 1,143,251 | 1,143,251 | 1,143,251 | 1,143,251 | 1,143,251 | 1,143,251 | 1,143,251 | 1,143,251 |
| 2001 | 1,144,971 | 1,144,971 | 1,144,971 | 1,144,971 | 1,144,971 | 1,144,971 | 1,157,620 | 1,157,620 | 1,157,620 | 1,157,620 | 1,157,620 | 1,157,620 |
| 2002 | 1,157,620 | 1,248,185 | 1,248,185 | 1,248,185 | 1,248,185 | 1,248,185 | 1,248,185 | 1,248,185 | 1,249,147 | 1,249,147 | 1,251,382 | 1,251,382 |
| 2003 | 1,251,382 | 1,251,382 | 1,251,382 | 1,251,382 | 1,251,382 | 1,268,444 | 1,268,444 | 1,268,444 | 1,269,103 | 1,269,103 | 1,269,103 | 1,269,103 |
| 2004 | 1,269,103 | 1,269,103 | 1,269,103 | 1,269,103 | 1,269,103 | 1,269,103 | 1,276,203 | 1,236,203 | 1,236,203 | 1,244,061 | 1,244,061 | 1,244,061 |
| 2005 | 1,264,868 | 1,264,868 | 1,264,868 | 1,264,868 | 1,264,868 | 1,264,868 | 1,264,868 | 1,264,868 | 1,264,868 | 1,264,868 | 1,264,868 | 1,264,868 |
| 2006 | 1,264,868 | 1,264,868 | 1,264,868 | 1,264,868 | 1,264,868 | 1,264,868 | 1,271,868 | 1,271,868 | 1,271,868 | 1,273,859 | 1,273,859 | 1,273,859 |
| 2007 | 1,269,266 | 1,269,266 | 1,269,266 | 1,269,266 | 1,269,266 | 1,269,266 | 1,269,266 | 1,269,266 | 1,277,574 | 1,269,574 | 1,269,574 | 1,272,036 |
| 2008 | 1,265,181 | 1,265,181 | 1,265,181 | 1,265,181 | 1,265,181 | 1,265,181 | 1,265,181 | 1,265,181 | 1,265,181 | 1,266,381 | 1,280,482 | 1,280,482 |
| 2009 | 1,280,482 | 1,280,482 | 1,280,482 | 1,280,482 | 1,291,282 | 1,291,282 | 1,291,282 | 1,291,282 | 1,301,982 | 1,301,982 | 1,301,982 | 1,311,449 |
| 2010 | 1,311,449 | 1,311,449 | 1,311,449 | 1,311,449 | 1,311,449 | 1,311,449 | 1,311,449 | 1,311,449 | 1,322,949 | 1,322,949 | 1,322,949 | 1,340,955 |
| 2011 | 1,340,955 | 1,340,955 | 1,340,955 | 1,340,955 | 1,340,955 | 1,340,955 | 1,340,955 | 1,340,955 | 1,340,955 | 1,343,054 | 1,343,054 | 1,343,054 |
| 2012 | 1,366,215 | 1,366,105 | 1,366,105 | 1,395,705 | 1,419,349 | 1,417,397 | 1,417,397 | 1,419,468 | 1,425,468 | 1,425,468 | 1,425,017 | 1,425,017 |
| 2013 | 1,424,046 | 1,423,965 | 1,423,965 | 1,423,965 | 1,457,013 | 1,457,013 | 1,464,013 | 1,464,013 | 1,464,013 | 1,464,013 | 1,464,013 | 1,464,013 |
| - = No Data Reported; -- = Not Applicable; NA = Not Available; W = Withheld to avoid disclosure of individual company data. |
| Release Date: 6/30/2026 |
| Next Release Date: 7/31/2026 |