|
Download Data (XLS File) |
|
|||||
|
|||||
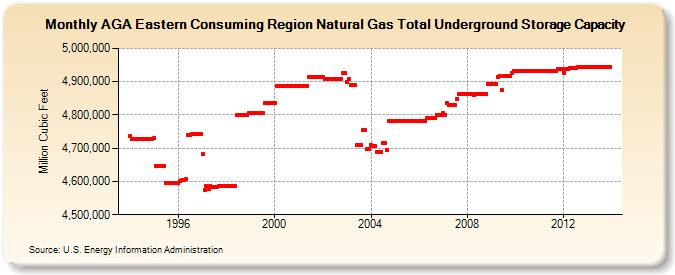
| AGA Eastern Consuming Region Natural Gas Total Underground Storage Capacity (Million Cubic Feet) | |||||
| Year | Jan | Feb | Mar | Apr | May | Jun | Jul | Aug | Sep | Oct | Nov | Dec |
|---|---|---|---|---|---|---|---|---|---|---|---|---|
| 1994 | 4,737,921 | 4,727,501 | 4,727,501 | 4,727,501 | 4,727,501 | 4,727,501 | 4,727,501 | 4,727,501 | 4,727,446 | 4,727,446 | 4,727,446 | 4,727,509 |
| 1995 | 4,730,109 | 4,647,791 | 4,647,791 | 4,647,791 | 4,647,791 | 4,647,791 | 4,593,948 | 4,593,948 | 4,593,948 | 4,593,948 | 4,593,948 | 4,593,948 |
| 1996 | 4,593,948 | 4,600,548 | 4,603,048 | 4,603,048 | 4,607,048 | 4,740,509 | 4,740,509 | 4,742,309 | 4,743,309 | 4,743,309 | 4,743,309 | 4,743,309 |
| 1997 | 4,681,090 | 4,574,740 | 4,586,024 | 4,578,486 | 4,586,024 | 4,582,146 | 4,582,146 | 4,582,146 | 4,585,702 | 4,585,702 | 4,585,702 | 4,585,702 |
| 1998 | 4,585,702 | 4,585,702 | 4,585,702 | 4,585,702 | 4,585,702 | 4,799,753 | 4,799,753 | 4,799,753 | 4,799,753 | 4,799,753 | 4,799,753 | 4,805,622 |
| 1999 | 4,805,622 | 4,805,622 | 4,805,622 | 4,805,622 | 4,805,622 | 4,805,622 | 4,805,622 | 4,836,812 | 4,836,812 | 4,836,962 | 4,836,962 | 4,836,962 |
| 2000 | 4,836,962 | 4,886,987 | 4,886,987 | 4,886,987 | 4,886,987 | 4,886,987 | 4,886,987 | 4,886,987 | 4,886,987 | 4,886,987 | 4,886,987 | 4,886,987 |
| 2001 | 4,886,987 | 4,886,987 | 4,886,987 | 4,886,987 | 4,886,987 | 4,913,035 | 4,914,624 | 4,914,624 | 4,914,624 | 4,914,624 | 4,914,624 | 4,914,624 |
| 2002 | 4,912,724 | 4,907,444 | 4,907,444 | 4,907,444 | 4,907,444 | 4,907,444 | 4,907,444 | 4,907,444 | 4,907,444 | 4,907,444 | 4,926,688 | 4,926,688 |
| 2003 | 4,899,001 | 4,907,782 | 4,889,909 | 4,889,909 | 4,889,909 | 4,709,413 | 4,709,413 | 4,710,657 | 4,754,690 | 4,754,612 | 4,698,279 | 4,698,159 |
| 2004 | 4,708,453 | 4,708,058 | 4,708,058 | 4,689,800 | 4,689,669 | 4,689,669 | 4,716,669 | 4,716,549 | 4,695,661 | 4,781,395 | 4,781,195 | 4,780,659 |
| 2005 | 4,780,659 | 4,780,659 | 4,780,584 | 4,780,659 | 4,780,659 | 4,780,659 | 4,780,659 | 4,781,659 | 4,781,659 | 4,781,659 | 4,781,659 | 4,781,659 |
| 2006 | 4,781,659 | 4,781,659 | 4,781,659 | 4,781,659 | 4,789,559 | 4,789,520 | 4,789,520 | 4,789,520 | 4,789,520 | 4,800,037 | 4,800,037 | 4,800,037 |
| 2007 | 4,805,437 | 4,800,037 | 4,835,037 | 4,829,637 | 4,829,637 | 4,829,637 | 4,829,637 | 4,848,837 | 4,862,614 | 4,862,614 | 4,862,614 | 4,862,614 |
| 2008 | 4,862,337 | 4,862,337 | 4,862,337 | 4,858,906 | 4,862,323 | 4,862,323 | 4,862,323 | 4,862,323 | 4,862,323 | 4,862,323 | 4,894,087 | 4,894,087 |
| 2009 | 4,894,087 | 4,894,087 | 4,894,087 | 4,913,559 | 4,916,887 | 4,876,249 | 4,916,887 | 4,916,887 | 4,916,887 | 4,916,887 | 4,926,887 | 4,933,129 |
| 2010 | 4,933,129 | 4,933,129 | 4,933,129 | 4,933,129 | 4,933,129 | 4,933,129 | 4,933,129 | 4,933,129 | 4,933,129 | 4,933,129 | 4,933,129 | 4,933,129 |
| 2011 | 4,933,129 | 4,933,129 | 4,933,129 | 4,933,129 | 4,933,129 | 4,933,129 | 4,933,129 | 4,933,129 | 4,933,129 | 4,936,729 | 4,936,855 | 4,936,855 |
| 2012 | 4,927,207 | 4,939,087 | 4,939,087 | 4,941,254 | 4,940,724 | 4,940,724 | 4,940,724 | 4,942,594 | 4,942,594 | 4,942,594 | 4,942,594 | 4,945,170 |
| 2013 | 4,943,970 | 4,943,950 | 4,943,955 | 4,944,155 | 4,944,600 | 4,944,600 | 4,944,950 | 4,944,950 | 4,944,950 | 4,944,950 | 4,944,950 | 4,944,950 |
| - = No Data Reported; -- = Not Applicable; NA = Not Available; W = Withheld to avoid disclosure of individual company data. |
| Release Date: 6/30/2026 |
| Next Release Date: 7/31/2026 |