|
Download Data (XLS File) |
|
|||||
|
|||||
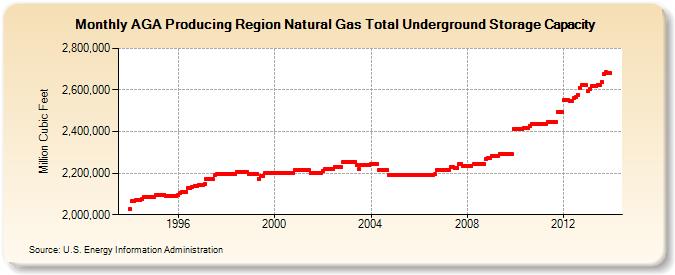
| AGA Producing Region Natural Gas Total Underground Storage Capacity (Million Cubic Feet) | |||||
| Year | Jan | Feb | Mar | Apr | May | Jun | Jul | Aug | Sep | Oct | Nov | Dec |
|---|---|---|---|---|---|---|---|---|---|---|---|---|
| 1994 | 2,026,828 | 2,068,220 | 2,068,220 | 2,068,428 | 2,068,428 | 2,068,428 | 2,074,428 | 2,082,928 | 2,082,928 | 2,082,928 | 2,082,928 | 2,082,928 |
| 1995 | 2,082,928 | 2,096,611 | 2,096,611 | 2,096,176 | 2,096,176 | 2,096,176 | 2,090,331 | 2,090,331 | 2,090,331 | 2,090,331 | 2,090,331 | 2,090,331 |
| 1996 | 2,095,131 | 2,106,116 | 2,110,116 | 2,108,116 | 2,110,116 | 2,127,294 | 2,126,618 | 2,134,784 | 2,140,284 | 2,140,284 | 2,144,784 | 2,144,784 |
| 1997 | 2,143,603 | 2,149,088 | 2,170,288 | 2,170,288 | 2,170,178 | 2,170,178 | 2,189,642 | 2,194,242 | 2,194,242 | 2,194,242 | 2,194,242 | 2,194,242 |
| 1998 | 2,194,242 | 2,194,242 | 2,194,242 | 2,194,242 | 2,194,242 | 2,205,540 | 2,205,540 | 2,205,540 | 2,205,540 | 2,205,540 | 2,205,540 | 2,197,859 |
| 1999 | 2,197,859 | 2,197,859 | 2,197,859 | 2,197,859 | 2,172,909 | 2,183,894 | 2,183,894 | 2,198,826 | 2,198,826 | 2,198,826 | 2,198,826 | 2,198,826 |
| 2000 | 2,198,826 | 2,199,020 | 2,199,020 | 2,199,020 | 2,199,020 | 2,199,020 | 2,199,020 | 2,199,020 | 2,199,020 | 2,199,020 | 2,216,020 | 2,216,020 |
| 2001 | 2,216,020 | 2,216,020 | 2,216,020 | 2,216,020 | 2,216,020 | 2,216,020 | 2,199,662 | 2,200,762 | 2,200,762 | 2,200,762 | 2,200,762 | 2,200,762 |
| 2002 | 2,211,612 | 2,219,725 | 2,220,792 | 2,220,792 | 2,220,792 | 2,220,792 | 2,228,692 | 2,228,692 | 2,229,692 | 2,229,692 | 2,252,968 | 2,252,968 |
| 2003 | 2,252,968 | 2,252,968 | 2,252,968 | 2,252,968 | 2,252,968 | 2,241,115 | 2,217,589 | 2,241,115 | 2,241,115 | 2,241,115 | 2,241,115 | 2,241,115 |
| 2004 | 2,241,912 | 2,241,912 | 2,241,912 | 2,241,912 | 2,216,912 | 2,216,912 | 2,216,912 | 2,216,912 | 2,216,912 | 2,191,140 | 2,191,140 | 2,191,140 |
| 2005 | 2,191,140 | 2,191,140 | 2,191,140 | 2,192,202 | 2,192,202 | 2,192,202 | 2,192,202 | 2,192,202 | 2,192,202 | 2,192,202 | 2,192,202 | 2,192,202 |
| 2006 | 2,192,202 | 2,192,202 | 2,192,202 | 2,192,202 | 2,192,202 | 2,192,202 | 2,192,202 | 2,192,202 | 2,195,642 | 2,212,848 | 2,212,848 | 2,212,848 |
| 2007 | 2,212,848 | 2,212,848 | 2,212,848 | 2,212,848 | 2,228,948 | 2,228,948 | 2,224,248 | 2,224,248 | 2,244,282 | 2,244,985 | 2,234,373 | 2,234,373 |
| 2008 | 2,234,373 | 2,234,373 | 2,234,373 | 2,242,373 | 2,242,373 | 2,242,373 | 2,242,373 | 2,242,373 | 2,242,373 | 2,267,873 | 2,272,337 | 2,272,337 |
| 2009 | 2,281,337 | 2,281,337 | 2,281,337 | 2,281,337 | 2,292,637 | 2,292,637 | 2,292,637 | 2,292,637 | 2,292,637 | 2,292,637 | 2,292,637 | 2,411,162 |
| 2010 | 2,411,162 | 2,411,162 | 2,411,162 | 2,411,162 | 2,416,402 | 2,416,402 | 2,416,402 | 2,427,012 | 2,435,830 | 2,435,830 | 2,435,830 | 2,435,830 |
| 2011 | 2,435,830 | 2,435,830 | 2,435,830 | 2,435,830 | 2,446,300 | 2,446,300 | 2,446,300 | 2,446,300 | 2,446,300 | 2,495,686 | 2,495,686 | 2,495,686 |
| 2012 | 2,549,528 | 2,549,528 | 2,549,528 | 2,545,770 | 2,545,770 | 2,561,018 | 2,563,976 | 2,577,948 | 2,611,254 | 2,623,509 | 2,622,924 | 2,622,348 |
| 2013 | 2,597,452 | 2,603,365 | 2,618,280 | 2,620,795 | 2,618,976 | 2,626,036 | 2,624,740 | 2,639,694 | 2,678,461 | 2,684,778 | 2,681,898 | 2,680,395 |
| - = No Data Reported; -- = Not Applicable; NA = Not Available; W = Withheld to avoid disclosure of individual company data. |
| Release Date: 6/30/2026 |
| Next Release Date: 7/31/2026 |