|
Download Data (XLS File) |
|
|||||
|
|||||
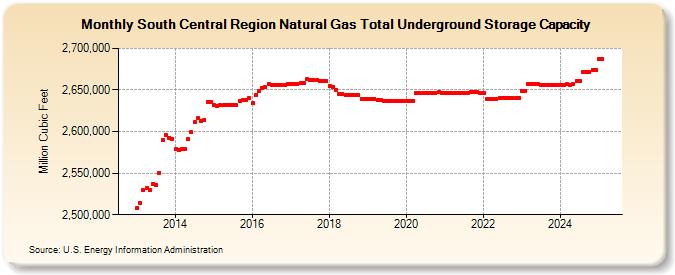
| South Central Region Natural Gas Total Underground Storage Capacity (Million Cubic Feet) | |||||
| Year | Jan | Feb | Mar | Apr | May | Jun | Jul | Aug | Sep | Oct | Nov | Dec |
|---|---|---|---|---|---|---|---|---|---|---|---|---|
| 2013 | 2,508,352 | 2,514,265 | 2,529,180 | 2,531,695 | 2,529,876 | 2,536,936 | 2,535,640 | 2,550,594 | 2,589,361 | 2,595,678 | 2,592,798 | 2,591,295 |
| 2014 | 2,578,946 | 2,577,866 | 2,578,498 | 2,578,547 | 2,590,575 | 2,599,184 | 2,611,335 | 2,616,178 | 2,612,570 | 2,613,746 | 2,635,148 | 2,634,993 |
| 2015 | 2,631,717 | 2,630,903 | 2,631,616 | 2,631,673 | 2,631,673 | 2,631,444 | 2,631,444 | 2,631,444 | 2,636,984 | 2,637,895 | 2,637,895 | 2,640,224 |
| 2016 | 2,634,512 | 2,644,516 | 2,649,080 | 2,652,492 | 2,653,124 | 2,657,366 | 2,656,178 | 2,656,178 | 2,656,158 | 2,655,853 | 2,656,020 | 2,656,959 |
| 2017 | 2,657,753 | 2,657,753 | 2,657,753 | 2,657,891 | 2,657,891 | 2,662,620 | 2,662,307 | 2,661,991 | 2,661,562 | 2,661,192 | 2,660,986 | 2,660,647 |
| 2018 | 2,654,512 | 2,653,951 | 2,650,451 | 2,645,440 | 2,645,440 | 2,643,575 | 2,644,075 | 2,644,075 | 2,644,075 | 2,643,715 | 2,639,377 | 2,638,787 |
| 2019 | 2,639,728 | 2,639,728 | 2,639,728 | 2,637,525 | 2,637,525 | 2,637,225 | 2,637,119 | 2,637,119 | 2,637,048 | 2,637,012 | 2,637,012 | 2,636,942 |
| 2020 | 2,637,046 | 2,637,012 | 2,636,975 | 2,646,414 | 2,646,685 | 2,646,651 | 2,646,604 | 2,646,580 | 2,646,546 | 2,646,587 | 2,646,976 | 2,646,940 |
| 2021 | 2,646,940 | 2,646,905 | 2,646,905 | 2,646,838 | 2,646,804 | 2,646,769 | 2,646,735 | 2,646,735 | 2,647,140 | 2,647,336 | 2,647,514 | 2,646,849 |
| 2022 | 2,646,737 | 2,639,626 | 2,639,626 | 2,639,428 | 2,639,393 | 2,640,499 | 2,640,464 | 2,640,430 | 2,640,386 | 2,640,352 | 2,640,433 | 2,640,398 |
| 2023 | 2,649,102 | 2,649,101 | 2,657,442 | 2,657,408 | 2,657,374 | 2,656,844 | 2,656,509 | 2,656,474 | 2,656,442 | 2,655,937 | 2,655,904 | 2,655,869 |
| 2024 | 2,656,338 | 2,656,317 | 2,656,752 | 2,656,427 | 2,657,142 | 2,661,109 | 2,661,054 | 2,672,020 | 2,671,908 | 2,671,874 | 2,674,318 | 2,674,285 |
| 2025 | 2,687,039 | 2,687,009 | 2,686,975 | 2,686,943 | 2,686,909 | 2,687,244 | 2,697,309 | 2,701,683 | 2,701,753 | 2,706,410 | 2,706,370 | 2,706,773 |
| 2026 | 2,705,643 | 2,703,519 | 2,703,474 | 2,704,750 | ||||||||
| - = No Data Reported; -- = Not Applicable; NA = Not Available; W = Withheld to avoid disclosure of individual company data. |
| Release Date: 6/30/2026 |
| Next Release Date: 7/31/2026 |