|
Download Data (XLS File) |
|
|||||
|
|||||
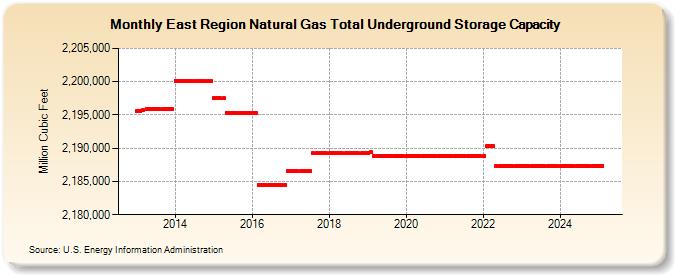
| East Region Natural Gas Total Underground Storage Capacity (Million Cubic Feet) | |||||
| Year | Jan | Feb | Mar | Apr | May | Jun | Jul | Aug | Sep | Oct | Nov | Dec |
|---|---|---|---|---|---|---|---|---|---|---|---|---|
| 2013 | 2,195,656 | 2,195,664 | 2,195,669 | 2,195,869 | 2,195,869 | 2,195,869 | 2,195,869 | 2,195,869 | 2,195,869 | 2,195,869 | 2,195,869 | 2,195,869 |
| 2014 | 2,200,169 | 2,200,169 | 2,200,169 | 2,200,169 | 2,200,169 | 2,200,169 | 2,200,169 | 2,200,169 | 2,200,169 | 2,200,169 | 2,200,169 | 2,200,169 |
| 2015 | 2,197,482 | 2,197,482 | 2,197,482 | 2,197,482 | 2,195,332 | 2,195,332 | 2,195,332 | 2,195,332 | 2,195,332 | 2,195,332 | 2,195,332 | 2,195,332 |
| 2016 | 2,195,332 | 2,195,332 | 2,184,529 | 2,184,529 | 2,184,529 | 2,184,529 | 2,184,529 | 2,184,529 | 2,184,529 | 2,184,529 | 2,184,529 | 2,186,529 |
| 2017 | 2,186,529 | 2,186,529 | 2,186,529 | 2,186,529 | 2,186,529 | 2,186,529 | 2,186,529 | 2,189,206 | 2,189,206 | 2,189,206 | 2,189,206 | 2,189,206 |
| 2018 | 2,189,206 | 2,189,206 | 2,189,206 | 2,189,206 | 2,189,206 | 2,189,206 | 2,189,206 | 2,189,206 | 2,189,206 | 2,189,206 | 2,189,206 | 2,189,206 |
| 2019 | 2,189,206 | 2,189,389 | 2,188,849 | 2,188,849 | 2,188,849 | 2,188,849 | 2,188,849 | 2,188,849 | 2,188,849 | 2,188,849 | 2,188,849 | 2,188,849 |
| 2020 | 2,188,849 | 2,188,849 | 2,188,849 | 2,188,849 | 2,188,849 | 2,188,849 | 2,188,849 | 2,188,849 | 2,188,849 | 2,188,849 | 2,188,849 | 2,188,849 |
| 2021 | 2,188,849 | 2,188,849 | 2,188,849 | 2,188,849 | 2,188,849 | 2,188,849 | 2,188,849 | 2,188,849 | 2,188,849 | 2,188,849 | 2,188,849 | 2,188,849 |
| 2022 | 2,188,849 | 2,190,318 | 2,190,318 | 2,190,318 | 2,187,330 | 2,187,330 | 2,187,330 | 2,187,330 | 2,187,330 | 2,187,340 | 2,187,340 | 2,187,340 |
| 2023 | 2,187,330 | 2,187,330 | 2,187,330 | 2,187,330 | 2,187,330 | 2,187,330 | 2,187,330 | 2,187,330 | 2,187,330 | 2,187,330 | 2,187,330 | 2,187,330 |
| 2024 | 2,187,330 | 2,187,330 | 2,187,330 | 2,187,330 | 2,187,330 | 2,187,330 | 2,187,330 | 2,187,330 | 2,187,330 | 2,187,330 | 2,187,330 | 2,187,330 |
| 2025 | 2,187,330 | 2,187,330 | 2,187,330 | 2,187,330 | 2,187,330 | 2,187,330 | 2,187,330 | 2,187,330 | 2,187,330 | 2,187,330 | 2,187,330 | 2,187,730 |
| 2026 | 2,187,730 | 2,187,730 | 2,187,734 | 2,187,734 | ||||||||
| - = No Data Reported; -- = Not Applicable; NA = Not Available; W = Withheld to avoid disclosure of individual company data. |
| Release Date: 6/30/2026 |
| Next Release Date: 7/31/2026 |