|
Download Data (XLS File) |
|
||||||||
|
||||||||
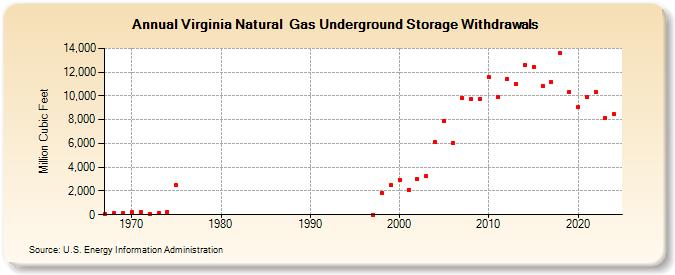
| Virginia Natural Gas Underground Storage Withdrawals (Million Cubic Feet) | ||||||||
| Decade | Year-0 | Year-1 | Year-2 | Year-3 | Year-4 | Year-5 | Year-6 | Year-7 | Year-8 | Year-9 |
|---|---|---|---|---|---|---|---|---|---|---|
| 1960's | 86 | 104 | 134 | |||||||
| 1970's | 193 | 247 | 93 | 137 | 258 | 2,472 | ||||
| 1990's | 0 | 1,859 | 2,470 | |||||||
| 2000's | 2,926 | 2,098 | 2,980 | 3,251 | 6,109 | 7,876 | 6,023 | 9,853 | 9,731 | 9,748 |
| 2010's | 11,578 | 9,917 | 11,405 | 11,044 | 12,608 | 12,462 | 10,826 | 11,178 | 13,594 | 10,344 |
| 2020's | 9,062 | 9,875 | 10,294 | 8,114 | 8,463 | 7,831 |
| - = No Data Reported; -- = Not Applicable; NA = Not Available; W = Withheld to avoid disclosure of individual company data. |
| Release Date: 6/30/2026 |
| Next Release Date: 7/31/2026 |