|
Download Data (XLS File) |
|
||||||||
|
||||||||
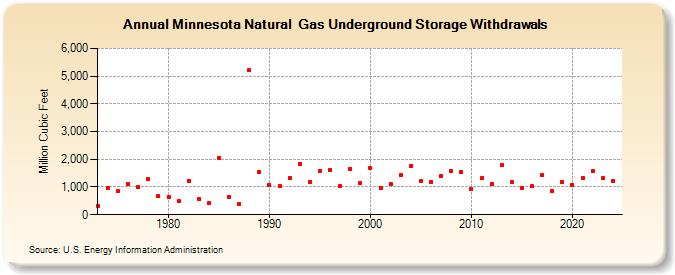
| Minnesota Natural Gas Underground Storage Withdrawals (Million Cubic Feet) | ||||||||
| Decade | Year-0 | Year-1 | Year-2 | Year-3 | Year-4 | Year-5 | Year-6 | Year-7 | Year-8 | Year-9 |
|---|---|---|---|---|---|---|---|---|---|---|
| 1970's | 298 | 979 | 843 | 1,111 | 1,003 | 1,286 | 668 | |||
| 1980's | 626 | 477 | 1,232 | 559 | 416 | 2,050 | 646 | 369 | 5,210 | 1,555 |
| 1990's | 1,077 | 1,018 | 1,329 | 1,834 | 1,192 | 1,582 | 1,625 | 1,044 | 1,663 | 1,131 |
| 2000's | 1,681 | 956 | 1,121 | 1,435 | 1,768 | 1,202 | 1,193 | 1,395 | 1,591 | 1,523 |
| 2010's | 911 | 1,310 | 1,115 | 1,779 | 1,185 | 966 | 1,022 | 1,447 | 853 | 1,174 |
| 2020's | 1,075 | 1,313 | 1,560 | 1,309 | 1,217 | 1,916 |
| - = No Data Reported; -- = Not Applicable; NA = Not Available; W = Withheld to avoid disclosure of individual company data. |
| Release Date: 6/30/2026 |
| Next Release Date: 7/31/2026 |