|
Download Data (XLS File) |
|
||||||||
|
||||||||
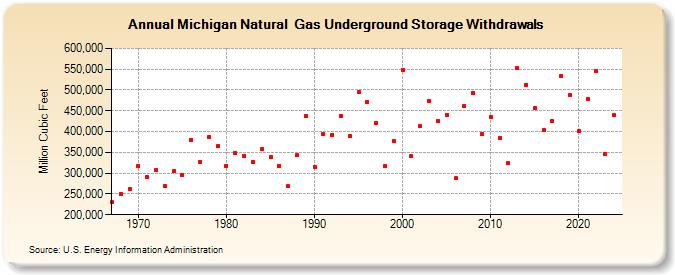
| Michigan Natural Gas Underground Storage Withdrawals (Million Cubic Feet) | ||||||||
| Decade | Year-0 | Year-1 | Year-2 | Year-3 | Year-4 | Year-5 | Year-6 | Year-7 | Year-8 | Year-9 |
|---|---|---|---|---|---|---|---|---|---|---|
| 1960's | 229,952 | 250,874 | 260,981 | |||||||
| 1970's | 317,397 | 289,599 | 306,491 | 268,071 | 305,092 | 294,867 | 380,555 | 327,422 | 386,571 | 364,649 |
| 1980's | 317,830 | 347,592 | 342,046 | 327,954 | 357,896 | 338,737 | 317,743 | 268,785 | 342,472 | 436,508 |
| 1990's | 314,461 | 394,196 | 392,716 | 437,280 | 389,224 | 494,531 | 471,467 | 421,264 | 316,201 | 376,613 |
| 2000's | 548,738 | 340,859 | 412,237 | 472,748 | 425,201 | 440,501 | 287,470 | 462,333 | 492,351 | 393,748 |
| 2010's | 434,764 | 385,364 | 323,187 | 551,992 | 511,739 | 455,481 | 403,268 | 425,036 | 532,605 | 488,353 |
| 2020's | 400,748 | 477,696 | 546,234 | 346,619 | 438,758 | 581,428 |
| - = No Data Reported; -- = Not Applicable; NA = Not Available; W = Withheld to avoid disclosure of individual company data. |
| Release Date: 6/30/2026 |
| Next Release Date: 7/31/2026 |