|
Download Data (XLS File) |
|
||||||||
|
||||||||
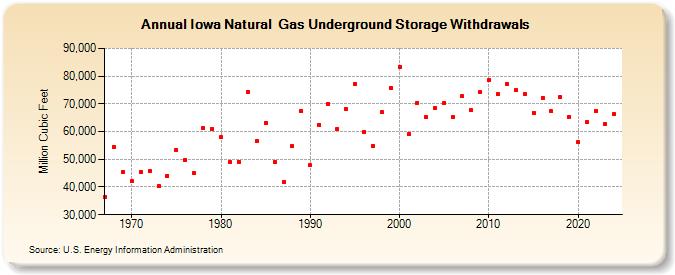
| Iowa Natural Gas Underground Storage Withdrawals (Million Cubic Feet) | ||||||||
| Decade | Year-0 | Year-1 | Year-2 | Year-3 | Year-4 | Year-5 | Year-6 | Year-7 | Year-8 | Year-9 |
|---|---|---|---|---|---|---|---|---|---|---|
| 1960's | 36,481 | 54,574 | 45,343 | |||||||
| 1970's | 42,068 | 45,400 | 45,858 | 40,352 | 44,114 | 53,404 | 49,749 | 44,965 | 61,256 | 61,018 |
| 1980's | 57,949 | 48,971 | 49,187 | 74,291 | 56,503 | 63,117 | 49,133 | 41,856 | 54,659 | 67,421 |
| 1990's | 47,770 | 62,486 | 70,077 | 61,007 | 68,162 | 77,228 | 59,831 | 54,877 | 67,047 | 75,843 |
| 2000's | 83,453 | 59,111 | 70,453 | 65,244 | 68,430 | 70,206 | 65,187 | 72,779 | 67,748 | 74,151 |
| 2010's | 78,444 | 73,538 | 77,291 | 74,867 | 73,442 | 66,812 | 72,251 | 67,262 | 72,443 | 65,208 |
| 2020's | 56,138 | 63,340 | 67,568 | 62,709 | 66,416 | 61,539 |
| - = No Data Reported; -- = Not Applicable; NA = Not Available; W = Withheld to avoid disclosure of individual company data. |
| Release Date: 6/30/2026 |
| Next Release Date: 7/31/2026 |