|
Download Data (XLS File) |
|
||||||||
|
||||||||
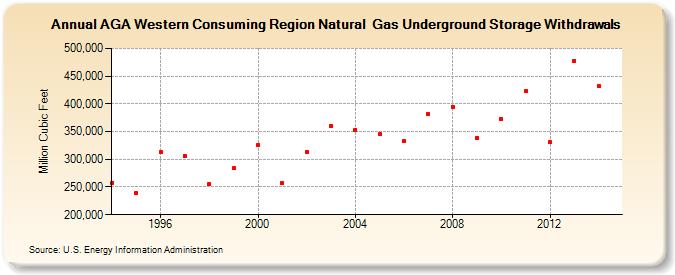
| AGA Western Consuming Region Natural Gas Underground Storage Withdrawals (Million Cubic Feet) | ||||||||
| Decade | Year-0 | Year-1 | Year-2 | Year-3 | Year-4 | Year-5 | Year-6 | Year-7 | Year-8 | Year-9 |
|---|---|---|---|---|---|---|---|---|---|---|
| 1990's | 257,901 | 238,856 | 313,746 | 306,119 | 255,135 | 284,184 | ||||
| 2000's | 325,895 | 256,828 | 313,541 | 359,615 | 353,542 | 345,970 | 332,631 | 381,724 | 394,442 | 339,022 |
| 2010's | 372,515 | 423,231 | 330,516 | 477,090 | 431,759 |
| - = No Data Reported; -- = Not Applicable; NA = Not Available; W = Withheld to avoid disclosure of individual company data. |
| Release Date: 6/30/2026 |
| Next Release Date: 7/31/2026 |