|
Download Data (XLS File) |
|
||||||||
|
||||||||
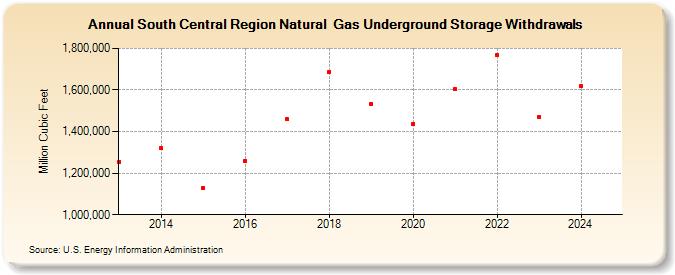
| South Central Region Natural Gas Underground Storage Withdrawals (Million Cubic Feet) | ||||||||
| Decade | Year-0 | Year-1 | Year-2 | Year-3 | Year-4 | Year-5 | Year-6 | Year-7 | Year-8 | Year-9 |
|---|---|---|---|---|---|---|---|---|---|---|
| 2010's | 1,254,800 | 1,319,357 | 1,130,830 | 1,260,002 | 1,458,822 | 1,688,180 | 1,534,496 | |||
| 2020's | 1,437,939 | 1,604,140 | 1,767,924 | 1,472,829 | 1,617,067 | 1,791,266 |
| - = No Data Reported; -- = Not Applicable; NA = Not Available; W = Withheld to avoid disclosure of individual company data. |
| Release Date: 6/30/2026 |
| Next Release Date: 7/31/2026 |