|
Download Data (XLS File) |
|
|||||
|
|||||
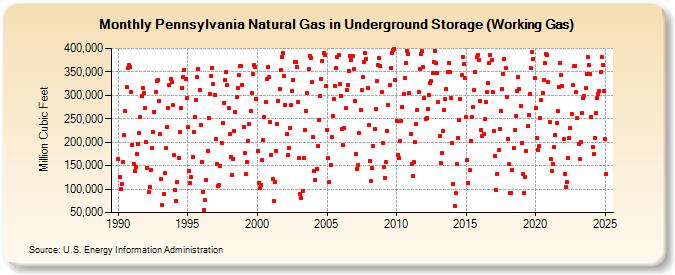
| Pennsylvania Natural Gas in Underground Storage (Working Gas) (Million Cubic Feet) | |||||
| Year | Jan | Feb | Mar | Apr | May | Jun | Jul | Aug | Sep | Oct | Nov | Dec |
|---|---|---|---|---|---|---|---|---|---|---|---|---|
| 1990 | 163,571 | 125,097 | 100,438 | 110,479 | 158,720 | 215,000 | 265,994 | 318,024 | 358,535 | 364,421 | 359,766 | 306,561 |
| 1991 | 194,349 | 153,061 | 137,579 | 147,399 | 174,145 | 196,678 | 219,025 | 254,779 | 297,531 | 315,601 | 305,179 | 272,103 |
| 1992 | 201,218 | 144,582 | 93,826 | 103,660 | 140,908 | 188,078 | 222,215 | 264,511 | 306,113 | 331,416 | 332,959 | 288,433 |
| 1993 | 217,967 | 120,711 | 66,484 | 89,931 | 133,866 | 187,940 | 233,308 | 272,685 | 320,921 | 334,285 | 328,073 | 278,791 |
| 1994 | 172,190 | 97,587 | 75,470 | 114,979 | 166,013 | 222,300 | 272,668 | 315,887 | 339,424 | 354,731 | 335,483 | 294,393 |
| 1995 | 232,561 | 139,624 | 111,977 | 124,790 | 168,112 | 221,731 | 253,442 | 290,185 | 338,021 | 355,887 | 311,749 | 236,656 |
| 1996 | 157,529 | 94,115 | 56,082 | 76,154 | 120,449 | 181,080 | 252,167 | 302,826 | 340,483 | 357,301 | 323,808 | 299,978 |
| 1997 | 206,567 | 154,075 | 106,344 | 107,931 | 149,631 | 198,708 | 240,766 | 284,155 | 332,824 | 348,766 | 322,975 | 273,866 |
| 1998 | 218,385 | 169,183 | 130,152 | 164,419 | 223,346 | 263,662 | 296,115 | 315,617 | 343,281 | 363,210 | 363,481 | 322,019 |
| 1999 | 233,072 | 176,298 | 131,349 | 157,594 | 203,425 | 238,834 | 266,897 | 304,689 | 346,026 | 365,009 | 360,549 | 292,002 |
| 2000 | 180,278 | 113,107 | 101,590 | 108,345 | 161,080 | 204,159 | 254,170 | 286,320 | 333,885 | 360,566 | 338,702 | 242,917 |
| 2001 | 173,673 | 121,978 | 75,074 | 115,335 | 180,832 | 238,272 | 288,700 | 314,418 | 354,295 | 381,110 | 390,286 | 342,034 |
| 2002 | 280,339 | 217,451 | 171,827 | 188,145 | 229,912 | 278,882 | 308,642 | 333,244 | 371,025 | 370,511 | 360,243 | 285,154 |
| 2003 | 165,299 | 89,803 | 81,470 | 96,505 | 166,027 | 226,938 | 266,424 | 304,602 | 356,471 | 383,434 | 379,316 | 327,715 |
| 2004 | 210,216 | 138,710 | 118,535 | 142,329 | 192,659 | 246,957 | 297,940 | 335,355 | 372,701 | 390,849 | 385,877 | 318,862 |
| 2005 | 226,698 | 166,050 | 114,881 | 152,377 | 211,054 | 256,119 | 292,402 | 320,787 | 357,792 | 382,630 | 386,675 | 323,148 |
| 2006 | 299,294 | 227,557 | 194,486 | 229,527 | 272,233 | 312,070 | 322,908 | 352,377 | 384,163 | 374,913 | 383,864 | 356,056 |
| 2007 | 288,622 | 174,876 | 143,163 | 151,680 | 218,875 | 269,340 | 310,957 | 338,380 | 370,363 | 390,855 | 378,064 | 314,981 |
| 2008 | 235,781 | 159,925 | 117,305 | 144,154 | 191,157 | 227,151 | 270,588 | 331,391 | 363,529 | 378,685 | 361,965 | 306,925 |
| 2009 | 198,828 | 146,493 | 123,933 | 157,544 | 224,492 | 279,618 | 321,259 | 359,108 | 389,503 | 397,044 | 398,846 | 332,499 |
| 2010 | 244,226 | 173,279 | 166,753 | 203,542 | 245,777 | 275,897 | 303,246 | 336,197 | 368,863 | 395,184 | 388,413 | 305,257 |
| 2011 | 217,033 | 153,945 | 128,146 | 157,200 | 200,725 | 239,036 | 269,329 | 307,694 | 356,623 | 387,315 | 394,295 | 360,106 |
| 2012 | 294,946 | 248,975 | 251,857 | 271,184 | 300,949 | 326,311 | 329,802 | 347,872 | 370,884 | 393,542 | 368,506 | 348,187 |
| 2013 | 285,135 | 212,915 | 156,274 | 176,594 | 223,996 | 269,659 | 291,175 | 312,646 | 349,981 | 369,166 | 349,937 | 294,767 |
| 2014 | 198,837 | 110,847 | 64,877 | 90,657 | 153,927 | 209,840 | 248,168 | 292,314 | 342,512 | 382,161 | 366,122 | 336,951 |
| 2015 | 253,497 | 161,142 | 113,769 | 140,875 | 203,246 | 254,450 | 275,371 | 310,546 | 349,293 | 380,696 | 386,683 | 375,251 |
| 2016 | 287,921 | 225,614 | 212,465 | 218,272 | 250,176 | 286,161 | 307,155 | 325,868 | 369,168 | 386,029 | 375,537 | 306,097 |
| 2017 | 223,786 | 169,647 | 98,921 | 132,374 | 182,486 | 229,177 | 265,651 | 313,223 | 346,462 | 377,860 | 357,365 | 296,277 |
| 2018 | 206,481 | 152,942 | 92,569 | 91,742 | 141,120 | 187,215 | 226,754 | 255,363 | 309,371 | 339,969 | 313,916 | 278,030 |
| 2019 | 198,263 | 133,241 | 92,063 | 125,619 | 181,080 | 234,360 | 257,513 | 301,834 | 357,538 | 391,959 | 378,123 | 335,898 |
| 2020 | 272,382 | 208,751 | 182,857 | 191,743 | 251,756 | 290,094 | 305,269 | 332,044 | 367,880 | 389,041 | 385,971 | 327,814 |
| 2021 | 242,998 | 163,131 | 139,465 | 153,794 | 190,011 | 215,934 | 241,611 | 265,460 | 317,436 | 369,056 | 342,704 | 320,295 |
| 2022 | 206,132 | 132,944 | 105,546 | 114,159 | 165,453 | 208,112 | 230,622 | 259,681 | 321,378 | 362,234 | 363,209 | 305,995 |
| 2023 | 250,679 | 196,946 | 163,751 | 201,391 | 263,106 | 294,768 | 299,223 | 315,950 | 344,952 | 381,934 | 365,231 | 344,492 |
| 2024 | 254,383 | 189,003 | 174,502 | 208,049 | 261,842 | 294,063 | 302,824 | 309,844 | 349,623 | 381,505 | 364,799 | 308,890 |
| 2025 | 206,072 | 132,254 | 126,799 | 156,008 | 216,963 | 259,612 | 267,889 | 300,183 | 344,623 | 374,578 | 369,870 | 303,400 |
| 2026 | 204,830 | 132,260 | 129,397 | 168,168 | ||||||||
| - = No Data Reported; -- = Not Applicable; NA = Not Available; W = Withheld to avoid disclosure of individual company data. |
| Release Date: 6/30/2026 |
| Next Release Date: 7/31/2026 |