|
Download Data (XLS File) |
|
|||||
|
|||||
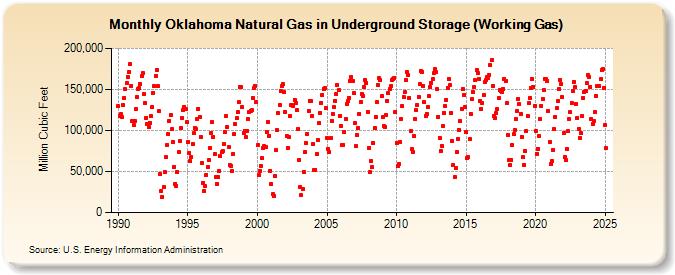
| Oklahoma Natural Gas in Underground Storage (Working Gas) (Million Cubic Feet) | |||||
| Year | Jan | Feb | Mar | Apr | May | Jun | Jul | Aug | Sep | Oct | Nov | Dec |
|---|---|---|---|---|---|---|---|---|---|---|---|---|
| 1990 | 129,245 | 118,053 | 119,532 | 116,520 | 130,817 | 139,698 | 150,336 | 158,048 | 165,206 | 171,008 | 180,706 | 154,515 |
| 1991 | 111,225 | 106,204 | 111,759 | 125,973 | 140,357 | 150,549 | 151,393 | 156,066 | 166,053 | 169,954 | 144,316 | 133,543 |
| 1992 | 115,658 | 107,281 | 103,919 | 109,690 | 117,435 | 128,505 | 145,962 | 153,948 | 166,637 | 174,182 | 154,096 | 123,225 |
| 1993 | 46,462 | 26,472 | 19,429 | 30,902 | 49,259 | 67,110 | 82,104 | 95,435 | 111,441 | 118,880 | 101,220 | 86,381 |
| 1994 | 56,024 | 35,272 | 32,781 | 49,507 | 73,474 | 86,632 | 102,758 | 115,789 | 124,652 | 129,107 | 126,148 | 109,979 |
| 1995 | 86,312 | 72,646 | 62,779 | 67,245 | 83,722 | 96,319 | 103,388 | 101,608 | 113,587 | 126,287 | 116,265 | 92,617 |
| 1996 | 60,493 | 36,597 | 26,665 | 31,864 | 46,087 | 55,613 | 63,823 | 78,788 | 97,529 | 109,860 | 92,152 | 70,939 |
| 1997 | 43,321 | 35,327 | 43,281 | 50,667 | 68,987 | 73,814 | 74,828 | 83,155 | 97,595 | 117,116 | 104,052 | 79,310 |
| 1998 | 58,185 | 57,047 | 50,175 | 71,472 | 95,112 | 107,387 | 114,674 | 122,178 | 134,297 | 153,366 | 152,641 | 128,591 |
| 1999 | 97,433 | 99,646 | 91,550 | 99,743 | 113,721 | 122,795 | 124,297 | 124,464 | 139,949 | 151,388 | 154,333 | 135,296 |
| 2000 | 82,180 | 45,925 | 50,720 | 57,222 | 65,976 | 78,560 | 80,941 | 79,741 | 97,684 | 110,483 | 93,753 | 51,160 |
| 2001 | 34,704 | 22,177 | 20,378 | 44,133 | 75,648 | 100,518 | 120,692 | 131,310 | 148,688 | 153,580 | 156,255 | 146,630 |
| 2002 | 122,716 | 93,104 | 79,066 | 92,213 | 117,691 | 130,675 | 131,629 | 130,338 | 137,289 | 133,949 | 124,695 | 102,066 |
| 2003 | 64,097 | 31,359 | 21,081 | 28,989 | 49,575 | 73,612 | 84,576 | 95,620 | 124,239 | 136,051 | 136,046 | 118,071 |
| 2004 | 83,811 | 52,077 | 52,031 | 71,323 | 88,902 | 109,094 | 121,777 | 133,829 | 143,009 | 151,089 | 151,485 | 127,312 |
| 2005 | 91,153 | 77,130 | 73,271 | 90,559 | 112,142 | 120,538 | 128,442 | 136,470 | 144,536 | 154,847 | 149,289 | 117,610 |
| 2006 | 105,214 | 82,389 | 82,638 | 98,407 | 114,235 | 132,477 | 135,913 | 140,151 | 160,638 | 164,866 | 160,731 | 145,436 |
| 2007 | 108,554 | 80,603 | 94,255 | 103,092 | 120,365 | 134,826 | 144,712 | 141,831 | 152,831 | 161,182 | 157,853 | 122,722 |
| 2008 | 78,544 | 48,968 | 62,902 | 54,969 | 85,033 | 103,025 | 116,767 | 134,181 | 155,326 | 163,462 | 161,289 | 141,765 |
| 2009 | 116,212 | 105,453 | 104,757 | 119,046 | 136,457 | 145,543 | 150,910 | 154,397 | 161,109 | 162,651 | 164,238 | 122,809 |
| 2010 | 85,006 | 56,316 | 59,002 | 86,428 | 114,154 | 129,837 | 141,023 | 146,559 | 161,928 | 170,989 | 168,133 | 139,752 |
| 2011 | 99,060 | 76,836 | 74,278 | 93,785 | 113,999 | 124,671 | 131,092 | 140,940 | 156,852 | 172,462 | 171,283 | 154,656 |
| 2012 | 134,338 | 117,747 | 120,532 | 128,894 | 141,563 | 152,690 | 158,164 | 162,706 | 169,946 | 174,458 | 171,127 | 150,461 |
| 2013 | 116,964 | 91,172 | 75,176 | 81,596 | 104,847 | 121,553 | 129,275 | 137,307 | 152,279 | 163,138 | 155,272 | 121,718 |
| 2014 | 87,705 | 58,154 | 43,549 | 54,237 | 74,021 | 90,034 | 100,815 | 111,329 | 126,688 | 150,738 | 143,691 | 128,192 |
| 2015 | 97,563 | 66,530 | 67,351 | 89,381 | 120,237 | 137,958 | 146,672 | 152,818 | 160,976 | 173,608 | 169,454 | 162,995 |
| 2016 | 136,212 | 126,100 | 133,962 | 143,332 | 158,643 | 161,664 | 165,010 | 163,906 | 167,948 | 179,687 | 185,271 | 154,415 |
| 2017 | 118,206 | 114,981 | 120,844 | 125,564 | 139,113 | 149,510 | 148,420 | 146,755 | 151,080 | 162,812 | 160,262 | 132,941 |
| 2018 | 94,851 | 63,589 | 58,096 | 64,266 | 82,107 | 95,169 | 100,475 | 113,918 | 124,195 | 138,660 | 131,789 | 120,433 |
| 2019 | 92,555 | 67,261 | 58,475 | 74,713 | 98,847 | 117,532 | 133,290 | 139,661 | 151,663 | 162,722 | 153,461 | 130,130 |
| 2020 | 99,216 | 71,555 | 77,873 | 92,684 | 113,833 | 129,824 | 138,543 | 148,850 | 163,290 | 162,264 | 160,671 | 123,587 |
| 2021 | 86,495 | 59,058 | 62,816 | 76,590 | 101,345 | 116,651 | 127,146 | 135,508 | 150,396 | 161,432 | 156,666 | 140,186 |
| 2022 | 96,659 | 67,435 | 64,032 | 77,377 | 98,811 | 114,156 | 122,156 | 133,536 | 148,191 | 159,587 | 153,045 | 132,407 |
| 2023 | 115,235 | 101,845 | 90,907 | 96,884 | 117,885 | 139,775 | 146,376 | 148,114 | 157,290 | 167,798 | 165,553 | 153,515 |
| 2024 | 114,209 | 108,382 | 110,954 | 122,916 | 142,420 | 153,923 | 153,867 | 154,452 | 162,212 | 173,918 | 174,647 | 152,122 |
| 2025 | 106,461 | 78,156 | 85,232 | 105,460 | 133,071 | 153,862 | 155,483 | 151,411 | 162,186 | 174,889 | 173,763 | 143,485 |
| 2026 | 107,262 | 92,904 | 98,897 | 115,638 | ||||||||
| - = No Data Reported; -- = Not Applicable; NA = Not Available; W = Withheld to avoid disclosure of individual company data. |
| Release Date: 6/30/2026 |
| Next Release Date: 7/31/2026 |