|
Download Data (XLS File) |
|
|||||
|
|||||
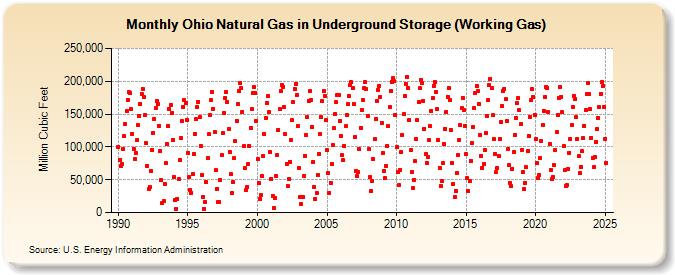
| Ohio Natural Gas in Underground Storage (Working Gas) (Million Cubic Feet) | |||||
| Year | Jan | Feb | Mar | Apr | May | Jun | Jul | Aug | Sep | Oct | Nov | Dec |
|---|---|---|---|---|---|---|---|---|---|---|---|---|
| 1990 | 100,467 | 79,364 | 70,578 | 73,582 | 96,173 | 115,927 | 135,350 | 154,385 | 171,798 | 182,858 | 181,763 | 157,536 |
| 1991 | 120,038 | 97,180 | 81,448 | 90,583 | 109,886 | 132,661 | 147,602 | 165,801 | 180,656 | 188,600 | 175,740 | 148,929 |
| 1992 | 105,511 | 70,674 | 36,141 | 38,587 | 63,604 | 95,665 | 121,378 | 143,128 | 158,570 | 169,712 | 164,562 | 132,576 |
| 1993 | 93,544 | 49,298 | 14,332 | 16,953 | 43,536 | 75,177 | 104,659 | 131,322 | 157,070 | 163,995 | 151,505 | 111,154 |
| 1994 | 54,508 | 19,250 | 5,261 | 21,115 | 50,569 | 80,259 | 113,598 | 139,298 | 161,031 | 171,539 | 167,524 | 141,551 |
| 1995 | 91,434 | 53,821 | 34,872 | 30,192 | 58,068 | 89,604 | 119,676 | 141,980 | 160,089 | 168,942 | 144,891 | 101,958 |
| 1996 | 57,929 | 24,267 | 5,841 | 16,123 | 46,104 | 83,041 | 118,907 | 147,899 | 170,782 | 183,731 | 158,150 | 123,210 |
| 1997 | 64,567 | 36,447 | 15,406 | 15,674 | 49,782 | 87,152 | 121,268 | 152,030 | 174,770 | 183,368 | 167,817 | 127,326 |
| 1998 | 92,364 | 58,403 | 29,708 | 46,067 | 82,369 | 108,292 | 139,579 | 165,056 | 184,508 | 197,141 | 189,177 | 153,879 |
| 1999 | 100,655 | 67,564 | 33,870 | 39,541 | 73,478 | 101,457 | 129,495 | 157,495 | 181,555 | 190,942 | 182,377 | 138,889 |
| 2000 | 81,955 | 45,386 | 20,386 | 26,330 | 55,551 | 86,165 | 119,351 | 144,300 | 166,979 | 177,177 | 153,296 | 92,525 |
| 2001 | 50,748 | 25,233 | 6,999 | 22,913 | 55,936 | 88,360 | 126,256 | 158,124 | 184,502 | 194,332 | 191,380 | 160,517 |
| 2002 | 118,960 | 74,534 | 40,486 | 50,884 | 77,552 | 109,926 | 140,727 | 167,604 | 188,857 | 195,794 | 178,414 | 131,754 |
| 2003 | 68,580 | 23,472 | 13,095 | 23,565 | 55,244 | 86,799 | 118,657 | 145,085 | 169,526 | 184,464 | 171,420 | 130,296 |
| 2004 | 77,329 | 39,399 | 20,725 | 29,729 | 57,643 | 89,563 | 120,174 | 145,249 | 170,064 | 185,096 | 177,748 | 140,679 |
| 2005 | 95,252 | 60,481 | 29,670 | 45,560 | 73,654 | 102,878 | 128,549 | 150,447 | 167,982 | 179,603 | 179,623 | 139,338 |
| 2006 | 116,967 | 86,994 | 79,578 | 101,232 | 131,248 | 148,718 | 165,464 | 177,805 | 194,765 | 198,485 | 190,413 | 165,968 |
| 2007 | 115,358 | 63,081 | 55,130 | 61,068 | 96,400 | 129,218 | 156,803 | 171,727 | 189,413 | 198,156 | 188,284 | 147,127 |
| 2008 | 96,498 | 54,205 | 32,640 | 48,610 | 80,948 | 111,761 | 142,921 | 169,580 | 186,586 | 192,929 | 176,355 | 137,138 |
| 2009 | 90,893 | 63,093 | 52,916 | 71,037 | 101,768 | 131,131 | 160,833 | 185,002 | 198,933 | 204,149 | 199,792 | 148,562 |
| 2010 | 99,535 | 62,426 | 41,419 | 65,296 | 91,732 | 118,163 | 149,582 | 177,720 | 195,883 | 206,471 | 189,679 | 140,706 |
| 2011 | 94,590 | 61,484 | 36,975 | 50,127 | 78,235 | 111,265 | 140,300 | 167,685 | 189,197 | 201,759 | 196,562 | 170,552 |
| 2012 | 127,766 | 89,179 | 75,989 | 83,993 | 110,297 | 131,740 | 154,866 | 174,695 | 193,171 | 199,217 | 183,924 | 158,022 |
| 2013 | 110,430 | 67,497 | 40,642 | 47,692 | 74,734 | 104,319 | 127,897 | 153,296 | 176,467 | 189,771 | 171,363 | 126,203 |
| 2014 | 75,663 | 43,179 | 23,600 | 32,692 | 59,859 | 88,063 | 110,985 | 133,653 | 159,037 | 174,910 | 156,234 | 132,469 |
| 2015 | 89,501 | 51,956 | 32,793 | 47,591 | 79,011 | 105,673 | 130,833 | 158,485 | 181,373 | 192,681 | 184,926 | 165,463 |
| 2016 | 118,381 | 86,221 | 68,618 | 73,670 | 95,224 | 121,482 | 147,257 | 170,926 | 193,565 | 203,888 | 189,428 | 148,165 |
| 2017 | 111,815 | 89,197 | 61,538 | 67,325 | 86,047 | 112,238 | 138,306 | 162,651 | 185,241 | 188,732 | 172,344 | 138,739 |
| 2018 | 96,277 | 71,853 | 44,561 | 40,382 | 66,727 | 92,597 | 118,516 | 144,341 | 167,083 | 174,106 | 155,528 | 134,208 |
| 2019 | 95,353 | 61,280 | 36,180 | 45,519 | 68,963 | 94,135 | 117,146 | 145,739 | 170,649 | 188,789 | 176,692 | 149,258 |
| 2020 | 112,069 | 74,839 | 52,561 | 57,060 | 82,445 | 109,138 | 132,718 | 155,312 | 175,939 | 191,034 | 189,033 | 153,541 |
| 2021 | 104,087 | 64,907 | 50,466 | 53,956 | 71,993 | 94,948 | 122,078 | 148,331 | 174,183 | 191,502 | 176,082 | 152,398 |
| 2022 | 101,216 | 64,264 | 40,622 | 41,939 | 66,433 | 91,325 | 112,212 | 133,644 | 161,038 | 178,251 | 172,924 | 145,106 |
| 2023 | 111,923 | 85,852 | 60,003 | 69,292 | 93,293 | 113,163 | 132,424 | 156,439 | 180,095 | 197,254 | 179,951 | 157,664 |
| 2024 | 113,920 | 83,391 | 68,805 | 84,198 | 107,150 | 127,274 | 144,205 | 160,413 | 180,547 | 198,094 | 191,967 | 160,509 |
| 2025 | 112,186 | 76,227 | 56,768 | 63,214 | 88,337 | 110,752 | 129,945 | 155,025 | 180,312 | 191,462 | 180,419 | 150,035 |
| 2026 | 107,647 | 76,424 | 58,846 | 68,219 | ||||||||
| - = No Data Reported; -- = Not Applicable; NA = Not Available; W = Withheld to avoid disclosure of individual company data. |
| Release Date: 6/30/2026 |
| Next Release Date: 7/31/2026 |