|
Download Data (XLS File) |
|
|||||
|
|||||
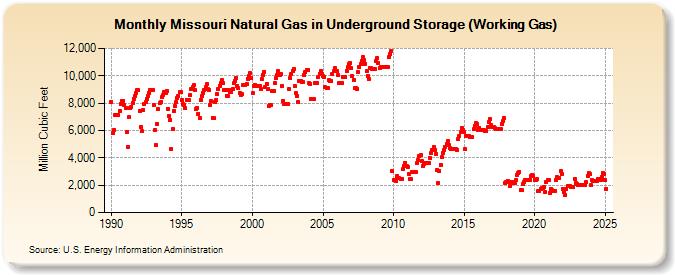
| Missouri Natural Gas in Underground Storage (Working Gas) (Million Cubic Feet) | |||||
| Year | Jan | Feb | Mar | Apr | May | Jun | Jul | Aug | Sep | Oct | Nov | Dec |
|---|---|---|---|---|---|---|---|---|---|---|---|---|
| 1990 | 8,081 | 5,796 | 6,047 | 7,156 | 7,151 | 7,146 | 7,140 | 7,421 | 7,927 | 8,148 | 8,157 | 7,869 |
| 1991 | 7,671 | 5,875 | 4,819 | 6,955 | 7,638 | 7,738 | 8,033 | 8,335 | 8,547 | 8,765 | 8,964 | 8,952 |
| 1992 | 7,454 | 6,256 | 5,927 | 7,497 | 7,924 | 8,071 | 8,337 | 8,555 | 8,763 | 8,954 | 8,946 | 8,939 |
| 1993 | 7,848 | 6,037 | 4,952 | 6,501 | 7,550 | 8,001 | 8,104 | 8,420 | 8,627 | 8,842 | 8,720 | 8,869 |
| 1994 | 7,602 | 7,073 | 6,794 | 4,640 | 6,094 | 7,449 | 7,765 | 8,072 | 8,341 | 8,548 | 8,778 | 8,783 |
| 1995 | 8,200 | 7,921 | 7,879 | 7,608 | 8,230 | 8,221 | 8,210 | 8,559 | 9,022 | 9,145 | 9,311 | 8,981 |
| 1996 | 7,558 | 7,658 | 7,225 | 6,931 | 8,250 | 8,511 | 8,751 | 8,958 | 9,162 | 9,372 | 9,067 | 8,993 |
| 1997 | 7,867 | 8,119 | 6,945 | 6,889 | 8,089 | 8,200 | 8,633 | 9,012 | 9,252 | 9,466 | 9,674 | 9,446 |
| 1998 | 8,988 | 8,978 | 8,555 | 8,507 | 8,968 | 8,825 | 8,817 | 9,020 | 9,434 | 9,642 | 9,846 | 9,272 |
| 1999 | 9,102 | 8,758 | 8,608 | 8,635 | 9,332 | 9,326 | 9,320 | 9,384 | 9,792 | 9,997 | 10,171 | 9,829 |
| 2000 | 8,708 | 9,256 | 9,354 | 9,251 | 9,276 | 9,256 | 9,239 | 9,024 | 9,735 | 10,088 | 10,278 | 9,167 |
| 2001 | 9,422 | 9,042 | 7,800 | 7,851 | 7,834 | 8,897 | 8,885 | 9,474 | 9,823 | 10,070 | 10,326 | 10,072 |
| 2002 | 10,095 | 9,270 | 8,181 | 7,966 | 7,956 | 7,943 | 7,925 | 9,021 | 9,802 | 10,096 | 10,367 | 10,485 |
| 2003 | 9,267 | 8,712 | 8,542 | 8,097 | 9,621 | 9,594 | 9,571 | 9,546 | 10,022 | 10,257 | 10,417 | 10,443 |
| 2004 | 9,460 | 9,431 | 8,323 | 8,295 | 8,273 | 9,470 | 9,465 | 9,452 | 9,910 | 10,159 | 10,357 | 10,145 |
| 2005 | 9,961 | 9,890 | 9,150 | 9,136 | 9,126 | 9,659 | 9,645 | 9,634 | 10,104 | 10,340 | 10,546 | 10,355 |
| 2006 | 10,327 | 10,038 | 9,477 | 9,463 | 9,452 | 9,929 | 9,919 | 9,911 | 10,382 | 10,617 | 10,887 | 10,904 |
| 2007 | 10,541 | 9,958 | 9,691 | 9,082 | 9,075 | 9,066 | 10,243 | 10,638 | 10,873 | 11,114 | 11,340 | 11,129 |
| 2008 | 10,885 | 10,313 | 9,984 | 9,749 | 10,553 | 10,540 | 10,530 | 10,513 | 10,505 | 11,078 | 11,276 | 10,928 |
| 2009 | 10,580 | 10,675 | 10,642 | 10,672 | 10,658 | 10,645 | 10,633 | 10,622 | 11,343 | 11,588 | 11,822 | 3,040 |
| 2010 | 2,413 | 2,353 | 2,323 | 2,682 | 2,515 | 2,500 | 2,488 | 2,475 | 3,154 | 3,405 | 3,656 | 3,385 |
| 2011 | 3,324 | 2,837 | 2,441 | 2,423 | 2,955 | 2,947 | 2,941 | 2,935 | 3,620 | 3,840 | 4,098 | 4,198 |
| 2012 | 3,763 | 3,399 | 3,532 | 3,626 | 3,611 | 3,599 | 3,595 | 3,983 | 4,357 | 4,592 | 4,815 | 4,597 |
| 2013 | 4,304 | 3,136 | 2,157 | 3,022 | 3,512 | 4,027 | 4,352 | 4,587 | 4,814 | 5,042 | 5,207 | 4,926 |
| 2014 | 4,700 | 4,643 | 4,642 | 4,647 | 4,646 | 4,617 | 4,605 | 5,369 | 5,613 | 5,911 | 6,216 | 6,070 |
| 2015 | 5,908 | 4,626 | 5,605 | 5,589 | 5,571 | 5,555 | 5,538 | 5,522 | 6,088 | 6,341 | 6,537 | 6,493 |
| 2016 | 6,045 | 6,198 | 6,063 | 6,035 | 6,019 | 6,002 | 5,979 | 5,956 | 6,226 | 6,615 | 6,810 | 6,431 |
| 2017 | 6,254 | 6,261 | 6,147 | 6,132 | 6,123 | 6,108 | 6,091 | 6,076 | 6,484 | 6,685 | 6,881 | 2,189 |
| 2018 | 2,203 | 2,337 | 2,238 | 1,918 | 2,245 | 2,221 | 2,196 | 2,172 | 2,416 | 2,746 | 2,870 | 2,988 |
| 2019 | 1,663 | 1,653 | 2,063 | 2,263 | 2,412 | 2,404 | 2,396 | 2,389 | 2,382 | 2,690 | 2,776 | 2,702 |
| 2020 | 2,410 | 2,389 | 2,417 | 1,549 | 1,582 | 1,737 | 1,766 | 1,820 | 1,849 | 1,483 | 2,267 | 2,387 |
| 2021 | 2,366 | 1,412 | 1,745 | 1,622 | 1,610 | 1,597 | 2,383 | 2,571 | 2,556 | 2,540 | 3,028 | 2,812 |
| 2022 | 1,731 | 1,470 | 1,286 | 1,731 | 1,951 | 1,933 | 1,933 | 1,902 | 1,892 | 1,880 | 2,475 | 2,176 |
| 2023 | 2,080 | 2,048 | 2,017 | 2,012 | 2,002 | 1,994 | 1,985 | 1,985 | 2,212 | 2,691 | 2,922 | 2,811 |
| 2024 | 1,993 | 2,366 | 2,330 | 2,324 | 2,320 | 2,326 | 2,430 | 2,424 | 2,414 | 2,605 | 2,916 | 2,849 |
| 2025 | 2,345 | 1,743 | 2,184 | 2,261 | 2,265 | 2,255 | 2,261 | 2,253 | 2,310 | 2,747 | 2,948 | 2,536 |
| 2026 | 1,320 | 2,184 | 2,473 | 2,470 | ||||||||
| - = No Data Reported; -- = Not Applicable; NA = Not Available; W = Withheld to avoid disclosure of individual company data. |
| Release Date: 6/30/2026 |
| Next Release Date: 7/31/2026 |