|
Download Data (XLS File) |
|
|||||
|
|||||
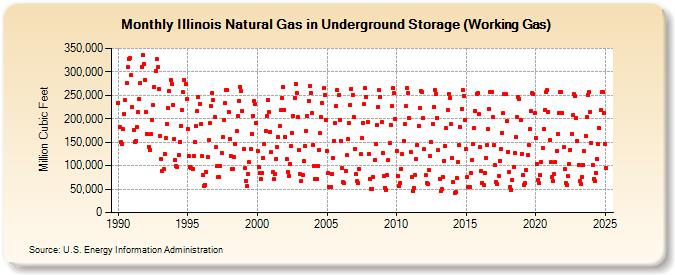
| Illinois Natural Gas in Underground Storage (Working Gas) (Million Cubic Feet) | |||||
| Year | Jan | Feb | Mar | Apr | May | Jun | Jul | Aug | Sep | Oct | Nov | Dec |
|---|---|---|---|---|---|---|---|---|---|---|---|---|
| 1990 | 234,149 | 182,982 | 149,826 | 145,903 | 177,193 | 210,075 | 239,633 | 275,310 | 309,341 | 328,106 | 329,864 | 292,842 |
| 1991 | 224,217 | 175,723 | 150,281 | 152,048 | 183,462 | 213,723 | 242,377 | 276,319 | 309,328 | 336,048 | 317,183 | 283,100 |
| 1992 | 214,872 | 167,256 | 140,681 | 132,922 | 166,585 | 198,351 | 228,870 | 267,309 | 302,100 | 328,395 | 310,252 | 264,393 |
| 1993 | 163,300 | 114,381 | 89,600 | 92,163 | 125,356 | 158,219 | 189,002 | 222,776 | 258,991 | 283,523 | 274,172 | 230,208 |
| 1994 | 157,199 | 113,092 | 98,529 | 97,958 | 121,798 | 151,412 | 184,055 | 218,595 | 255,984 | 282,845 | 274,095 | 241,584 |
| 1995 | 178,160 | 120,195 | 97,724 | 93,988 | 92,541 | 121,374 | 151,483 | 183,573 | 215,512 | 246,439 | 232,236 | 188,151 |
| 1996 | 120,519 | 79,256 | 56,219 | 59,154 | 86,393 | 118,776 | 154,567 | 190,009 | 226,947 | 255,683 | 239,749 | 203,700 |
| 1997 | 138,998 | 98,793 | 75,078 | 75,280 | 99,145 | 127,551 | 160,637 | 196,838 | 233,525 | 261,895 | 260,426 | 214,951 |
| 1998 | 156,932 | 120,860 | 92,702 | 93,474 | 117,747 | 146,257 | 173,791 | 205,365 | 238,735 | 267,807 | 258,346 | 216,601 |
| 1999 | 135,873 | 94,105 | 67,346 | 56,392 | 82,340 | 108,258 | 134,603 | 167,871 | 206,322 | 237,949 | 231,869 | 189,881 |
| 2000 | 132,190 | 96,786 | 84,010 | 71,004 | 84,301 | 117,369 | 146,094 | 174,487 | 206,117 | 240,807 | 214,939 | 172,041 |
| 2001 | 129,212 | 85,661 | 71,411 | 82,609 | 114,242 | 140,178 | 160,520 | 184,198 | 217,720 | 243,762 | 267,342 | 219,574 |
| 2002 | 161,736 | 113,770 | 86,779 | 77,962 | 104,139 | 141,616 | 170,069 | 206,423 | 244,947 | 274,666 | 255,261 | 203,035 |
| 2003 | 132,405 | 82,065 | 67,106 | 80,514 | 109,713 | 142,320 | 174,663 | 204,926 | 238,005 | 270,223 | 255,645 | 212,175 |
| 2004 | 144,641 | 99,863 | 71,185 | 71,924 | 99,617 | 134,068 | 168,863 | 202,952 | 234,082 | 264,621 | 250,163 | 198,299 |
| 2005 | 132,232 | 83,972 | 55,493 | 53,698 | 82,694 | 117,194 | 153,297 | 190,315 | 227,865 | 261,643 | 250,717 | 198,093 |
| 2006 | 153,300 | 94,611 | 64,245 | 63,063 | 89,354 | 121,953 | 155,762 | 191,932 | 230,311 | 264,060 | 250,715 | 203,910 |
| 2007 | 135,524 | 81,300 | 66,832 | 62,066 | 92,454 | 124,123 | 158,037 | 191,475 | 230,656 | 265,789 | 246,542 | 193,583 |
| 2008 | 125,404 | 70,986 | 50,370 | 50,418 | 75,957 | 111,563 | 146,306 | 186,643 | 225,689 | 261,541 | 247,238 | 192,434 |
| 2009 | 127,374 | 77,570 | 52,447 | 49,152 | 79,678 | 112,915 | 148,576 | 187,702 | 228,180 | 264,630 | 254,317 | 199,106 |
| 2010 | 131,031 | 78,002 | 56,665 | 64,056 | 93,880 | 125,022 | 152,376 | 188,058 | 226,231 | 265,070 | 255,567 | 201,427 |
| 2011 | 128,872 | 76,400 | 46,800 | 52,708 | 79,932 | 113,389 | 144,722 | 184,768 | 223,348 | 258,711 | 256,516 | 202,602 |
| 2012 | 134,587 | 79,171 | 63,763 | 61,926 | 90,925 | 119,634 | 150,855 | 189,702 | 225,161 | 261,222 | 252,353 | 201,836 |
| 2013 | 132,835 | 72,024 | 45,603 | 50,160 | 76,598 | 110,815 | 142,938 | 179,343 | 218,245 | 252,919 | 244,957 | 188,012 |
| 2014 | 115,818 | 66,097 | 42,443 | 44,327 | 73,093 | 107,952 | 143,370 | 182,604 | 221,065 | 260,629 | 249,373 | 198,287 |
| 2015 | 134,758 | 76,654 | 55,463 | 54,896 | 83,725 | 112,590 | 145,276 | 179,696 | 216,934 | 253,690 | 254,824 | 209,121 |
| 2016 | 139,517 | 89,243 | 63,862 | 59,753 | 85,401 | 116,447 | 144,886 | 178,422 | 219,785 | 257,468 | 256,765 | 203,126 |
| 2017 | 143,738 | 100,821 | 65,553 | 61,844 | 78,951 | 110,601 | 135,781 | 170,336 | 211,642 | 251,807 | 252,161 | 194,471 |
| 2018 | 129,774 | 86,768 | 55,415 | 48,533 | 68,800 | 97,672 | 126,407 | 161,080 | 203,800 | 247,060 | 241,940 | 197,601 |
| 2019 | 125,854 | 80,861 | 59,656 | 62,827 | 91,390 | 122,310 | 144,108 | 177,121 | 215,735 | 254,887 | 252,371 | 211,681 |
| 2020 | 159,166 | 103,869 | 69,185 | 62,389 | 80,408 | 108,048 | 137,496 | 177,849 | 218,292 | 256,428 | 260,310 | 215,056 |
| 2021 | 155,627 | 107,036 | 75,596 | 66,523 | 81,374 | 107,010 | 132,261 | 167,218 | 212,382 | 256,652 | 257,419 | 212,095 |
| 2022 | 138,734 | 92,659 | 62,858 | 58,710 | 77,066 | 103,241 | 133,722 | 168,348 | 207,233 | 252,409 | 247,453 | 201,375 |
| 2023 | 153,452 | 102,194 | 66,288 | 60,941 | 75,887 | 102,179 | 130,307 | 164,062 | 203,843 | 249,732 | 256,519 | 214,959 |
| 2024 | 149,362 | 101,565 | 72,411 | 67,954 | 85,096 | 114,807 | 146,238 | 179,244 | 218,534 | 256,714 | 256,759 | 211,999 |
| 2025 | 146,005 | 93,993 | 74,377 | 75,226 | 93,300 | 120,513 | 142,728 | 171,583 | 212,894 | 257,507 | 256,892 | 209,161 |
| 2026 | 141,501 | 96,573 | 75,877 | 77,356 | ||||||||
| - = No Data Reported; -- = Not Applicable; NA = Not Available; W = Withheld to avoid disclosure of individual company data. |
| Release Date: 6/30/2026 |
| Next Release Date: 7/31/2026 |