|
Download Data (XLS File) |
|
||||||||
|
||||||||
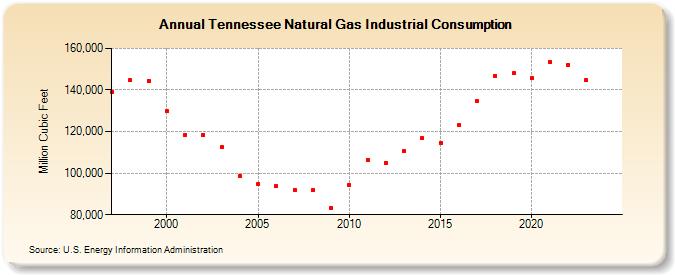
| Tennessee Natural Gas Industrial Consumption (Million Cubic Feet) | ||||||||
| Decade | Year-0 | Year-1 | Year-2 | Year-3 | Year-4 | Year-5 | Year-6 | Year-7 | Year-8 | Year-9 |
|---|---|---|---|---|---|---|---|---|---|---|
| 1990's | 138,863 | 144,560 | 144,542 | |||||||
| 2000's | 129,716 | 118,566 | 118,241 | 112,446 | 98,701 | 94,898 | 93,600 | 91,923 | 91,835 | 83,315 |
| 2010's | 94,320 | 106,522 | 105,046 | 110,475 | 116,882 | 114,682 | 122,953 | 134,555 | 146,889 | 147,959 |
| 2020's | 145,855 | 153,566 | 152,123 | 144,657 | 161,596 | 173,689 |
| - = No Data Reported; -- = Not Applicable; NA = Not Available; W = Withheld to avoid disclosure of individual company data. |
| Release Date: 6/30/2026 |
| Next Release Date: 7/31/2026 |