|
Download Data (XLS File) |
|
||||||||
|
||||||||
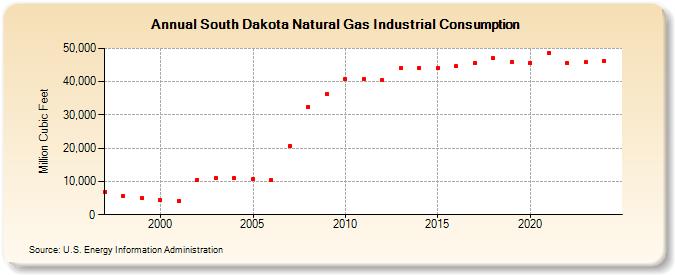
| South Dakota Natural Gas Industrial Consumption (Million Cubic Feet) | ||||||||
| Decade | Year-0 | Year-1 | Year-2 | Year-3 | Year-4 | Year-5 | Year-6 | Year-7 | Year-8 | Year-9 |
|---|---|---|---|---|---|---|---|---|---|---|
| 1990's | 6,928 | 5,607 | 5,043 | |||||||
| 2000's | 4,323 | 4,211 | 10,584 | 11,181 | 10,967 | 10,661 | 10,426 | 20,701 | 32,466 | 36,301 |
| 2010's | 40,755 | 40,668 | 40,432 | 44,039 | 44,205 | 44,094 | 44,570 | 45,641 | 46,972 | 46,014 |
| 2020's | 45,621 | 48,732 | 45,573 | 45,761 | 46,352 | 44,144 |
| - = No Data Reported; -- = Not Applicable; NA = Not Available; W = Withheld to avoid disclosure of individual company data. |
| Release Date: 6/30/2026 |
| Next Release Date: 7/31/2026 |