|
Download Data (XLS File) |
|
||||||||
|
||||||||
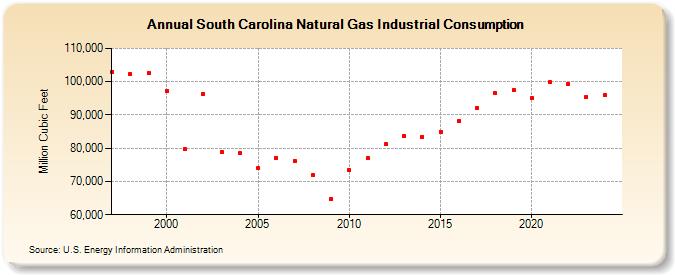
| South Carolina Natural Gas Industrial Consumption (Million Cubic Feet) | ||||||||
| Decade | Year-0 | Year-1 | Year-2 | Year-3 | Year-4 | Year-5 | Year-6 | Year-7 | Year-8 | Year-9 |
|---|---|---|---|---|---|---|---|---|---|---|
| 1990's | 102,929 | 102,324 | 102,635 | |||||||
| 2000's | 97,295 | 79,674 | 96,268 | 78,807 | 78,421 | 74,002 | 77,171 | 76,286 | 71,924 | 64,655 |
| 2010's | 73,397 | 76,973 | 81,165 | 83,730 | 83,443 | 84,898 | 88,148 | 92,198 | 96,485 | 97,550 |
| 2020's | 95,145 | 99,792 | 99,186 | 95,394 | 95,257 | 89,363 |
| - = No Data Reported; -- = Not Applicable; NA = Not Available; W = Withheld to avoid disclosure of individual company data. |
| Release Date: 6/30/2026 |
| Next Release Date: 7/31/2026 |