|
Download Data (XLS File) |
|
||||||||
|
||||||||
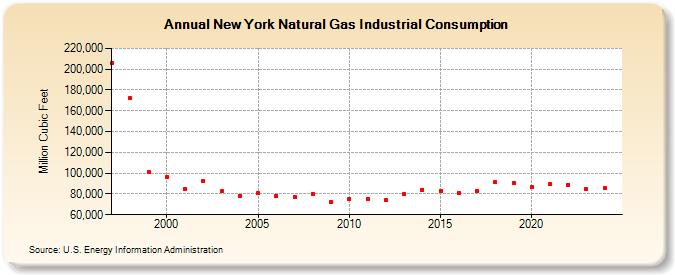
| New York Natural Gas Industrial Consumption (Million Cubic Feet) | ||||||||
| Decade | Year-0 | Year-1 | Year-2 | Year-3 | Year-4 | Year-5 | Year-6 | Year-7 | Year-8 | Year-9 |
|---|---|---|---|---|---|---|---|---|---|---|
| 1990's | 205,746 | 172,043 | 101,564 | |||||||
| 2000's | 96,508 | 84,411 | 92,249 | 82,429 | 78,289 | 80,682 | 77,827 | 77,273 | 79,966 | 72,166 |
| 2010's | 75,475 | 75,162 | 74,133 | 79,776 | 84,255 | 83,058 | 80,850 | 82,848 | 91,430 | 90,330 |
| 2020's | 86,401 | 89,731 | 88,968 | 84,720 | 83,773 | 88,595 |
| - = No Data Reported; -- = Not Applicable; NA = Not Available; W = Withheld to avoid disclosure of individual company data. |
| Release Date: 5/29/2026 |
| Next Release Date: 6/30/2026 |