|
Download Data (XLS File) |
|
||||||||
|
||||||||
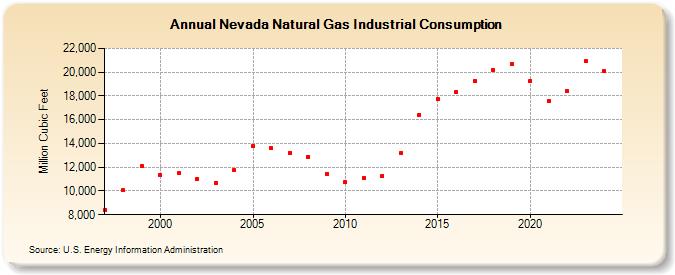
| Nevada Natural Gas Industrial Consumption (Million Cubic Feet) | ||||||||
| Decade | Year-0 | Year-1 | Year-2 | Year-3 | Year-4 | Year-5 | Year-6 | Year-7 | Year-8 | Year-9 |
|---|---|---|---|---|---|---|---|---|---|---|
| 1990's | 8,411 | 10,046 | 12,107 | |||||||
| 2000's | 11,334 | 11,475 | 11,022 | 10,671 | 11,737 | 13,753 | 13,574 | 13,234 | 12,888 | 11,458 |
| 2010's | 10,728 | 11,080 | 11,299 | 13,209 | 16,432 | 17,724 | 18,327 | 19,269 | 20,153 | 20,681 |
| 2020's | 19,264 | 17,558 | 18,403 | 20,899 | 20,184 | NA |
| - = No Data Reported; -- = Not Applicable; NA = Not Available; W = Withheld to avoid disclosure of individual company data. |
| Release Date: 6/30/2026 |
| Next Release Date: 7/31/2026 |