|
Download Data (XLS File) |
|
||||||||
|
||||||||
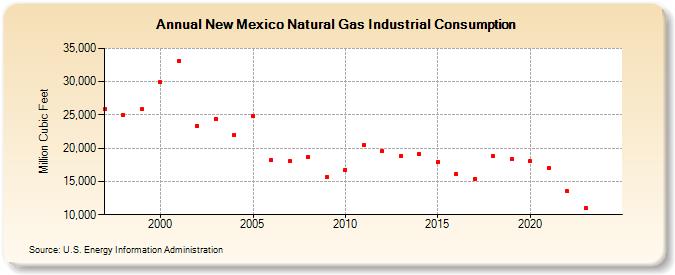
| New Mexico Natural Gas Industrial Consumption (Million Cubic Feet) | ||||||||
| Decade | Year-0 | Year-1 | Year-2 | Year-3 | Year-4 | Year-5 | Year-6 | Year-7 | Year-8 | Year-9 |
|---|---|---|---|---|---|---|---|---|---|---|
| 1990's | 25,875 | 25,048 | 25,842 | |||||||
| 2000's | 29,886 | 33,154 | 23,366 | 24,381 | 22,048 | 24,823 | 18,239 | 18,023 | 18,702 | 15,680 |
| 2010's | 16,779 | 20,500 | 19,582 | 18,794 | 19,091 | 17,937 | 16,109 | 15,412 | 18,769 | 18,362 |
| 2020's | 18,006 | 17,086 | 13,507 | 11,024 | 15,601 | NA |
| - = No Data Reported; -- = Not Applicable; NA = Not Available; W = Withheld to avoid disclosure of individual company data. |
| Release Date: 6/30/2026 |
| Next Release Date: 7/31/2026 |