|
Download Data (XLS File) |
|
||||||||
|
||||||||
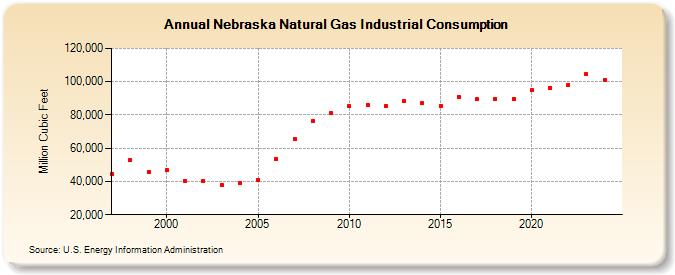
| Nebraska Natural Gas Industrial Consumption (Million Cubic Feet) | ||||||||
| Decade | Year-0 | Year-1 | Year-2 | Year-3 | Year-4 | Year-5 | Year-6 | Year-7 | Year-8 | Year-9 |
|---|---|---|---|---|---|---|---|---|---|---|
| 1990's | 44,418 | 53,053 | 45,750 | |||||||
| 2000's | 46,816 | 40,145 | 40,426 | 38,115 | 38,866 | 40,948 | 53,408 | 65,656 | 76,259 | 80,873 |
| 2010's | 85,180 | 86,128 | 85,439 | 88,140 | 86,878 | 85,604 | 91,021 | 89,521 | 89,516 | 89,696 |
| 2020's | 94,881 | 96,364 | 98,156 | 104,303 | 107,961 | 107,207 |
| - = No Data Reported; -- = Not Applicable; NA = Not Available; W = Withheld to avoid disclosure of individual company data. |
| Release Date: 6/30/2026 |
| Next Release Date: 7/31/2026 |