|
Download Data (XLS File) |
|
||||||||
|
||||||||
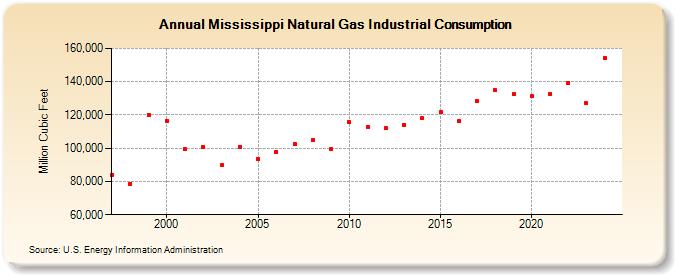
| Mississippi Natural Gas Industrial Consumption (Million Cubic Feet) | ||||||||
| Decade | Year-0 | Year-1 | Year-2 | Year-3 | Year-4 | Year-5 | Year-6 | Year-7 | Year-8 | Year-9 |
|---|---|---|---|---|---|---|---|---|---|---|
| 1990's | 83,967 | 78,640 | 120,134 | |||||||
| 2000's | 116,644 | 99,341 | 100,956 | 89,719 | 101,002 | 93,518 | 97,736 | 102,487 | 104,842 | 99,252 |
| 2010's | 115,489 | 112,959 | 111,995 | 114,198 | 117,908 | 121,835 | 116,105 | 128,356 | 134,953 | 132,714 |
| 2020's | 131,207 | 132,754 | 139,338 | 127,351 | 147,102 | 141,793 |
| - = No Data Reported; -- = Not Applicable; NA = Not Available; W = Withheld to avoid disclosure of individual company data. |
| Release Date: 6/30/2026 |
| Next Release Date: 7/31/2026 |