|
Download Data (XLS File) |
|
||||||||
|
||||||||
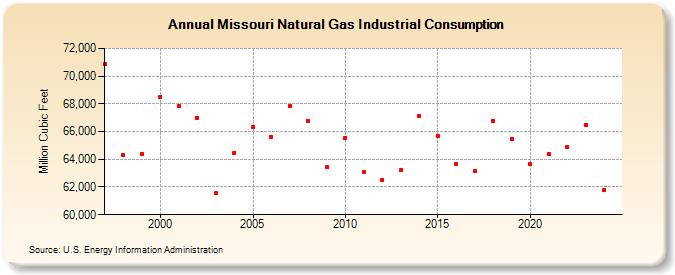
| Missouri Natural Gas Industrial Consumption (Million Cubic Feet) | ||||||||
| Decade | Year-0 | Year-1 | Year-2 | Year-3 | Year-4 | Year-5 | Year-6 | Year-7 | Year-8 | Year-9 |
|---|---|---|---|---|---|---|---|---|---|---|
| 1990's | 70,865 | 64,284 | 64,402 | |||||||
| 2000's | 68,496 | 67,846 | 66,965 | 61,545 | 64,483 | 66,350 | 65,627 | 67,868 | 66,758 | 63,431 |
| 2010's | 65,554 | 63,053 | 62,516 | 63,212 | 67,115 | 65,691 | 63,630 | 63,158 | 66,744 | 65,452 |
| 2020's | 63,635 | 64,384 | 64,874 | 66,501 | 67,994 | 69,050 |
| - = No Data Reported; -- = Not Applicable; NA = Not Available; W = Withheld to avoid disclosure of individual company data. |
| Release Date: 6/30/2026 |
| Next Release Date: 7/31/2026 |