|
Download Data (XLS File) |
|
||||||||
|
||||||||
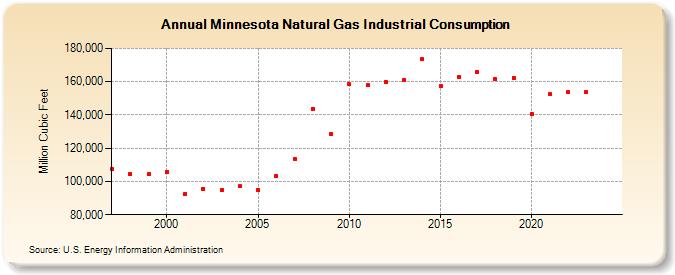
| Minnesota Natural Gas Industrial Consumption (Million Cubic Feet) | ||||||||
| Decade | Year-0 | Year-1 | Year-2 | Year-3 | Year-4 | Year-5 | Year-6 | Year-7 | Year-8 | Year-9 |
|---|---|---|---|---|---|---|---|---|---|---|
| 1990's | 107,322 | 104,610 | 104,187 | |||||||
| 2000's | 105,875 | 92,452 | 95,671 | 94,772 | 97,103 | 94,989 | 103,009 | 113,504 | 143,837 | 128,361 |
| 2010's | 158,457 | 157,776 | 159,947 | 160,732 | 173,569 | 157,401 | 162,818 | 165,901 | 161,560 | 162,437 |
| 2020's | 140,554 | 152,378 | 153,556 | 153,495 | 150,968 | 135,141 |
| - = No Data Reported; -- = Not Applicable; NA = Not Available; W = Withheld to avoid disclosure of individual company data. |
| Release Date: 6/30/2026 |
| Next Release Date: 7/31/2026 |