|
Download Data (XLS File) |
|
||||||||
|
||||||||
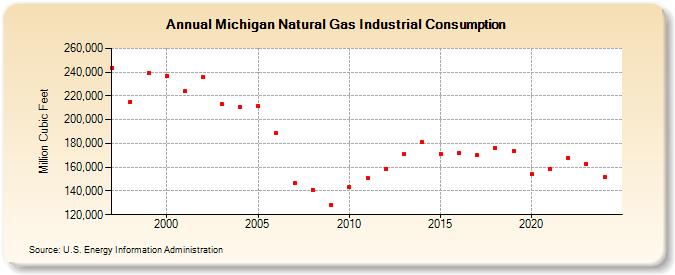
| Michigan Natural Gas Industrial Consumption (Million Cubic Feet) | ||||||||
| Decade | Year-0 | Year-1 | Year-2 | Year-3 | Year-4 | Year-5 | Year-6 | Year-7 | Year-8 | Year-9 |
|---|---|---|---|---|---|---|---|---|---|---|
| 1990's | 243,338 | 215,135 | 239,392 | |||||||
| 2000's | 237,030 | 223,855 | 236,133 | 213,252 | 210,501 | 211,539 | 188,508 | 146,585 | 141,182 | 128,504 |
| 2010's | 143,351 | 151,083 | 158,591 | 170,833 | 180,829 | 171,196 | 172,006 | 170,189 | 176,250 | 173,618 |
| 2020's | 154,149 | 158,649 | 167,907 | 163,105 | 153,786 | 163,307 |
| - = No Data Reported; -- = Not Applicable; NA = Not Available; W = Withheld to avoid disclosure of individual company data. |
| Release Date: 6/30/2026 |
| Next Release Date: 7/31/2026 |