|
Download Data (XLS File) |
|
||||||||
|
||||||||
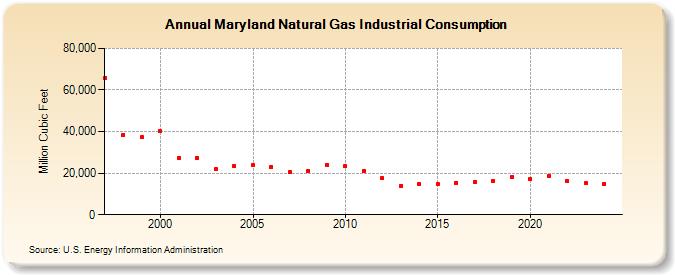
| Maryland Natural Gas Industrial Consumption (Million Cubic Feet) | ||||||||
| Decade | Year-0 | Year-1 | Year-2 | Year-3 | Year-4 | Year-5 | Year-6 | Year-7 | Year-8 | Year-9 |
|---|---|---|---|---|---|---|---|---|---|---|
| 1990's | 65,954 | 38,531 | 37,213 | |||||||
| 2000's | 40,067 | 27,412 | 27,183 | 21,829 | 23,360 | 23,772 | 23,015 | 20,413 | 21,153 | 23,926 |
| 2010's | 23,371 | 21,220 | 17,626 | 13,989 | 14,734 | 14,765 | 15,400 | 15,744 | 16,227 | 18,336 |
| 2020's | 17,069 | 18,720 | 16,190 | 15,096 | 15,152 | NA |
| - = No Data Reported; -- = Not Applicable; NA = Not Available; W = Withheld to avoid disclosure of individual company data. |
| Release Date: 6/30/2026 |
| Next Release Date: 7/31/2026 |