|
Download Data (XLS File) |
|
||||||||
|
||||||||
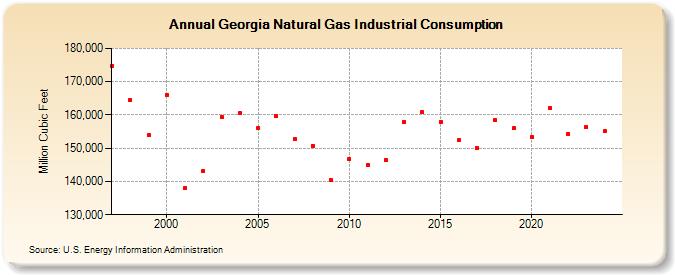
| Georgia Natural Gas Industrial Consumption (Million Cubic Feet) | ||||||||
| Decade | Year-0 | Year-1 | Year-2 | Year-3 | Year-4 | Year-5 | Year-6 | Year-7 | Year-8 | Year-9 |
|---|---|---|---|---|---|---|---|---|---|---|
| 1990's | 174,746 | 164,499 | 153,867 | |||||||
| 2000's | 166,126 | 137,899 | 143,152 | 159,406 | 160,559 | 156,202 | 159,614 | 152,674 | 150,773 | 140,326 |
| 2010's | 146,737 | 144,940 | 146,481 | 157,982 | 160,842 | 157,937 | 152,311 | 150,172 | 158,445 | 155,992 |
| 2020's | 153,342 | 162,005 | 154,267 | 156,368 | 156,496 | 152,280 |
| - = No Data Reported; -- = Not Applicable; NA = Not Available; W = Withheld to avoid disclosure of individual company data. |
| Release Date: 6/30/2026 |
| Next Release Date: 7/31/2026 |