|
Download Data (XLS File) |
|
||||||||
|
||||||||
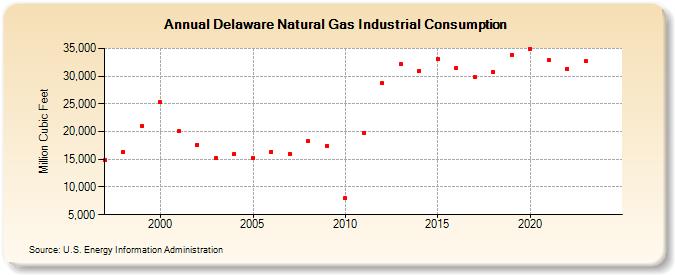
| Delaware Natural Gas Industrial Consumption (Million Cubic Feet) | ||||||||
| Decade | Year-0 | Year-1 | Year-2 | Year-3 | Year-4 | Year-5 | Year-6 | Year-7 | Year-8 | Year-9 |
|---|---|---|---|---|---|---|---|---|---|---|
| 1990's | 14,805 | 16,287 | 21,075 | |||||||
| 2000's | 25,325 | 20,059 | 17,634 | 15,172 | 16,025 | 15,257 | 16,398 | 16,014 | 18,216 | 17,402 |
| 2010's | 7,983 | 19,760 | 28,737 | 32,154 | 31,004 | 33,126 | 31,457 | 29,860 | 30,783 | 33,865 |
| 2020's | 34,896 | 32,826 | 31,367 | 32,648 | 29,115 | 30,646 |
| - = No Data Reported; -- = Not Applicable; NA = Not Available; W = Withheld to avoid disclosure of individual company data. |
| Release Date: 6/30/2026 |
| Next Release Date: 7/31/2026 |