|
Download Data (XLS File) |
|
||||||||
|
||||||||
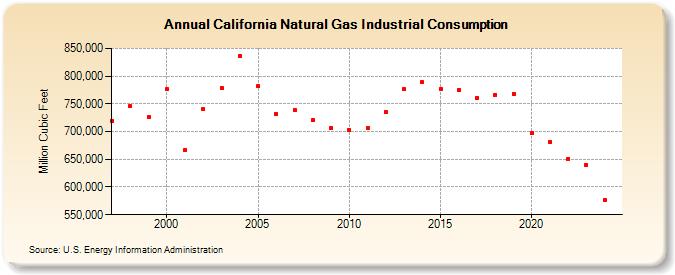
| California Natural Gas Industrial Consumption (Million Cubic Feet) | ||||||||
| Decade | Year-0 | Year-1 | Year-2 | Year-3 | Year-4 | Year-5 | Year-6 | Year-7 | Year-8 | Year-9 |
|---|---|---|---|---|---|---|---|---|---|---|
| 1990's | 719,540 | 745,774 | 725,948 | |||||||
| 2000's | 776,202 | 666,462 | 740,194 | 779,085 | 835,824 | 781,381 | 732,054 | 738,501 | 720,592 | 706,154 |
| 2010's | 703,536 | 706,350 | 735,925 | 775,969 | 788,817 | 777,102 | 774,503 | 760,661 | 766,415 | 768,188 |
| 2020's | 697,168 | 681,620 | 651,305 | 639,983 | 581,570 | 540,645 |
| - = No Data Reported; -- = Not Applicable; NA = Not Available; W = Withheld to avoid disclosure of individual company data. |
| Release Date: 6/30/2026 |
| Next Release Date: 7/31/2026 |