|
Download Data (XLS File) |
|
||||||||
|
||||||||
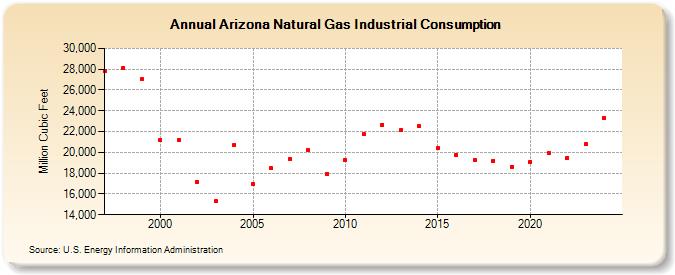
| Arizona Natural Gas Industrial Consumption (Million Cubic Feet) | ||||||||
| Decade | Year-0 | Year-1 | Year-2 | Year-3 | Year-4 | Year-5 | Year-6 | Year-7 | Year-8 | Year-9 |
|---|---|---|---|---|---|---|---|---|---|---|
| 1990's | 27,864 | 28,157 | 27,032 | |||||||
| 2000's | 21,220 | 21,228 | 17,155 | 15,277 | 20,713 | 16,975 | 18,447 | 19,355 | 20,184 | 17,948 |
| 2010's | 19,245 | 21,724 | 22,657 | 22,153 | 22,489 | 20,402 | 19,765 | 19,250 | 19,169 | 18,625 |
| 2020's | 19,079 | 19,941 | 19,489 | 20,802 | 23,097 | 24,763 |
| - = No Data Reported; -- = Not Applicable; NA = Not Available; W = Withheld to avoid disclosure of individual company data. |
| Release Date: 6/30/2026 |
| Next Release Date: 7/31/2026 |