|
Download Data (XLS File) |
|
||||||||
|
||||||||
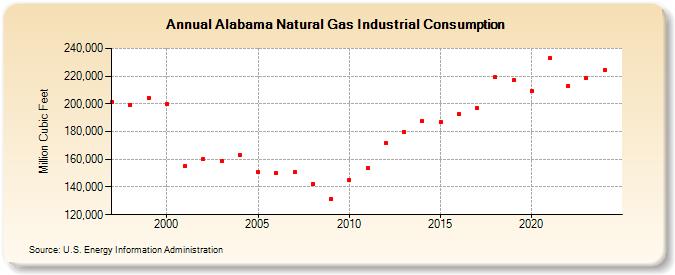
| Alabama Natural Gas Industrial Consumption (Million Cubic Feet) | ||||||||
| Decade | Year-0 | Year-1 | Year-2 | Year-3 | Year-4 | Year-5 | Year-6 | Year-7 | Year-8 | Year-9 |
|---|---|---|---|---|---|---|---|---|---|---|
| 1990's | 201,240 | 199,192 | 204,261 | |||||||
| 2000's | 199,904 | 155,054 | 159,938 | 158,512 | 163,255 | 151,102 | 149,973 | 150,484 | 142,389 | 131,228 |
| 2010's | 144,938 | 153,358 | 171,729 | 179,511 | 187,661 | 186,819 | 192,424 | 196,654 | 219,057 | 217,040 |
| 2020's | 209,124 | 233,072 | 212,943 | 218,463 | 226,400 | 240,536 |
| - = No Data Reported; -- = Not Applicable; NA = Not Available; W = Withheld to avoid disclosure of individual company data. |
| Release Date: 6/30/2026 |
| Next Release Date: 7/31/2026 |