|
Download Data (XLS File) |
|
||||||||
|
||||||||
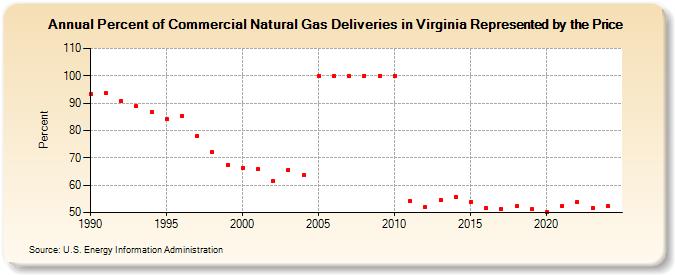
| Percent of Commercial Natural Gas Deliveries in Virginia Represented by the Price (Percent) | ||||||||
| Decade | Year-0 | Year-1 | Year-2 | Year-3 | Year-4 | Year-5 | Year-6 | Year-7 | Year-8 | Year-9 |
|---|---|---|---|---|---|---|---|---|---|---|
| 1990's | 93.2 | 93.6 | 90.7 | 88.8 | 86.7 | 84.1 | 85.3 | 77.9 | 72.1 | 67.4 |
| 2000's | 66.4 | 65.8 | 61.4 | 65.7 | 63.6 | 100.0 | 100.0 | 100.0 | 100.0 | 100.0 |
| 2010's | 100.0 | 54.1 | 52.1 | 54.6 | 55.8 | 54.0 | 51.7 | 51.3 | 52.3 | 51.2 |
| 2020's | 50.2 | 52.5 | 53.8 | 51.7 | 52.2 | 56.7 |
| - = No Data Reported; -- = Not Applicable; NA = Not Available; W = Withheld to avoid disclosure of individual company data. |
| Release Date: 6/30/2026 |
| Next Release Date: 7/31/2026 |