|
Download Data (XLS File) |
|
||||||||
|
||||||||
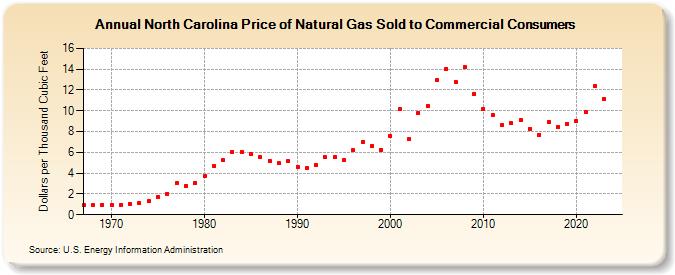
| North Carolina Price of Natural Gas Sold to Commercial Consumers (Dollars per Thousand Cubic Feet) | ||||||||
| Decade | Year-0 | Year-1 | Year-2 | Year-3 | Year-4 | Year-5 | Year-6 | Year-7 | Year-8 | Year-9 |
|---|---|---|---|---|---|---|---|---|---|---|
| 1960's | 0.91 | 0.90 | 0.94 | |||||||
| 1970's | 0.96 | 0.98 | 1.07 | 1.14 | 1.28 | 1.74 | 2.04 | 3.05 | 2.79 | 3.09 |
| 1980's | 3.71 | 4.72 | 5.24 | 6.01 | 6.07 | 5.84 | 5.56 | 5.21 | 4.94 | 5.14 |
| 1990's | 4.63 | 4.53 | 4.79 | 5.51 | 5.56 | 5.24 | 6.18 | 7.00 | 6.63 | 6.22 |
| 2000's | 7.61 | 10.14 | 7.25 | 9.79 | 10.45 | 12.93 | 14.06 | 12.77 | 14.19 | 11.63 |
| 2010's | 10.18 | 9.64 | 8.62 | 8.81 | 9.12 | 8.27 | 7.71 | 8.92 | 8.48 | 8.76 |
| 2020's | 9.01 | 9.87 | 12.35 | 11.17 | 8.23 | 12.71 |
| - = No Data Reported; -- = Not Applicable; NA = Not Available; W = Withheld to avoid disclosure of individual company data. |
| Release Date: 6/30/2026 |
| Next Release Date: 7/31/2026 |