|
Download Data (XLS File) |
|
|||||
|
|||||
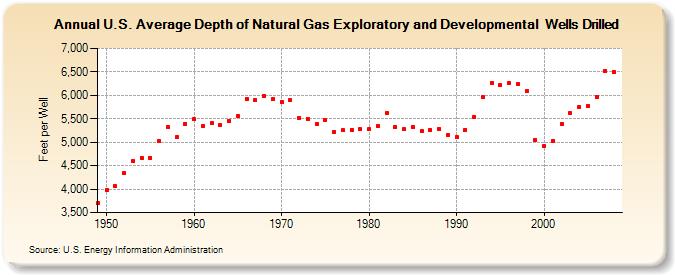
| U.S. Average Depth of Natural Gas Exploratory and Developmental Wells Drilled (Feet per Well) | |||||
| Decade | Year-0 | Year-1 | Year-2 | Year-3 | Year-4 | Year-5 | Year-6 | Year-7 | Year-8 | Year-9 |
|---|---|---|---|---|---|---|---|---|---|---|
| 1940's | 3,698 | |||||||||
| 1950's | 3,979 | 4,056 | 4,342 | 4,599 | 4,670 | 4,672 | 5,018 | 5,326 | 5,106 | 5,396 |
| 1960's | 5,486 | 5,339 | 5,408 | 5,368 | 5,453 | 5,562 | 5,928 | 5,898 | 5,994 | 5,918 |
| 1970's | 5,860 | 5,890 | 5,516 | 5,488 | 5,387 | 5,470 | 5,220 | 5,254 | 5,262 | 5,275 |
| 1980's | 5,275 | 5,351 | 5,617 | 5,319 | 5,276 | 5,326 | 5,238 | 5,260 | 5,288 | 5,154 |
| 1990's | 5,114 | 5,267 | 5,543 | 5,957 | 6,272 | 6,219 | 6,267 | 6,243 | 6,088 | 5,049 |
| 2000's | 4,923 | 5,030 | 5,389 | 5,616 | 5,757 | 5,777 | 5,961 | 6,522 | 6,500 |
| - = No Data Reported; -- = Not Applicable; NA = Not Available; W = Withheld to avoid disclosure of individual company data. |
| Release Date: 6/30/2026 |
| Next Release Date: 7/31/2026 |
Referring Pages: