|
Download Data (XLS File) |
|
||||||||
|
||||||||
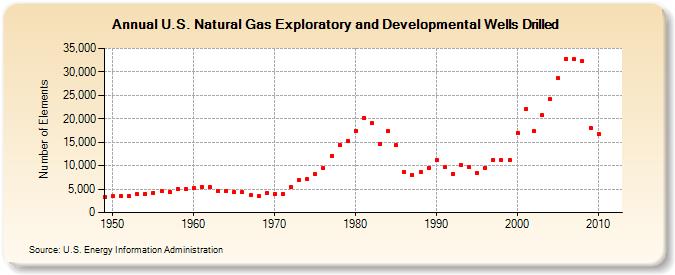
| U.S. Natural Gas Exploratory and Developmental Wells Drilled (Number of Elements) | ||||||||
| Decade | Year-0 | Year-1 | Year-2 | Year-3 | Year-4 | Year-5 | Year-6 | Year-7 | Year-8 | Year-9 |
|---|---|---|---|---|---|---|---|---|---|---|
| 1940's | 3,363 | |||||||||
| 1950's | 3,439 | 3,438 | 3,514 | 3,968 | 4,038 | 4,266 | 4,531 | 4,475 | 5,005 | 4,931 |
| 1960's | 5,149 | 5,486 | 5,353 | 4,570 | 4,694 | 4,482 | 4,377 | 3,659 | 3,456 | 4,083 |
| 1970's | 4,011 | 3,971 | 5,440 | 6,933 | 7,138 | 8,127 | 9,409 | 12,122 | 14,413 | 15,254 |
| 1980's | 17,461 | 20,250 | 19,076 | 14,684 | 17,338 | 14,324 | 8,599 | 8,096 | 8,578 | 9,522 |
| 1990's | 11,126 | 9,611 | 8,305 | 10,174 | 9,739 | 8,454 | 9,539 | 11,186 | 11,127 | 11,121 |
| 2000's | 17,051 | 22,072 | 17,342 | 20,722 | 24,186 | 28,590 | 32,838 | 32,719 | 32,246 | 18,088 |
| 2010's | 16,696 | NA | NA |
| - = No Data Reported; -- = Not Applicable; NA = Not Available; W = Withheld to avoid disclosure of individual company data. |
| Release Date: 6/30/2026 |
| Next Release Date: 7/31/2026 |
Referring Pages: