|
Download Data (XLS File) |
|
|||||
|
|||||
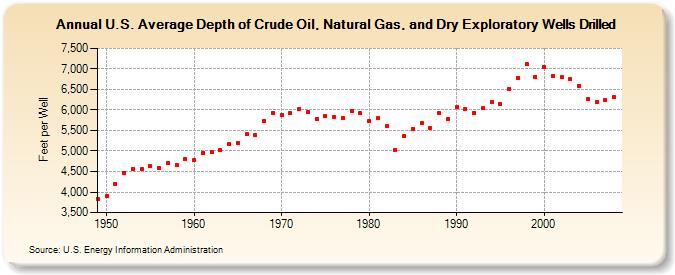
| U.S. Average Depth of Crude Oil, Natural Gas, and Dry Exploratory Wells Drilled (Feet per Well) | |||||
| Decade | Year-0 | Year-1 | Year-2 | Year-3 | Year-4 | Year-5 | Year-6 | Year-7 | Year-8 | Year-9 |
|---|---|---|---|---|---|---|---|---|---|---|
| 1940's | 3,842 | |||||||||
| 1950's | 3,898 | 4,197 | 4,476 | 4,557 | 4,550 | 4,632 | 4,587 | 4,702 | 4,658 | 4,795 |
| 1960's | 4,770 | 4,953 | 4,966 | 5,016 | 5,174 | 5,198 | 5,402 | 5,388 | 5,739 | 5,924 |
| 1970's | 5,885 | 5,915 | 6,015 | 5,955 | 5,777 | 5,842 | 5,825 | 5,798 | 5,978 | 5,916 |
| 1980's | 5,733 | 5,793 | 5,597 | 5,035 | 5,369 | 5,544 | 5,680 | 5,563 | 5,917 | 5,769 |
| 1990's | 6,076 | 6,015 | 5,930 | 6,037 | 6,190 | 6,141 | 6,520 | 6,790 | 7,110 | 6,814 |
| 2000's | 7,056 | 6,836 | 6,792 | 6,744 | 6,579 | 6,272 | 6,187 | 6,247 | 6,322 |
| - = No Data Reported; -- = Not Applicable; NA = Not Available; W = Withheld to avoid disclosure of individual company data. |
| Release Date: 6/30/2026 |
| Next Release Date: 7/31/2026 |
Referring Pages: