|
Executive Summary
This report responds to a request to the Energy Information Administration (EIA) from Chairman Henry Waxman and Chairman Edward Markey for an analysis of H.R. 2454, the American Clean Energy and Security Act of 2009 (ACESA).1 ACESA, as passed by the House of Representatives on June 26, 2009, is a complex bill that regulates emissions of greenhouse gases through market-based mechanisms, efficiency programs, and economic incentives.
The Title III cap-and-trade program for greenhouse gas (GHG) emissions, which covers roughly 84 percent of total U.S. GHG emissions by 2016, is in many respects the centerpiece of the bill and the primary driver of the results presented in this report. The program subjects covered emissions to a cap that declines steadily between 2012 and 2050. The cap requires a 17- percent reduction in covered emissions by 2020 and an 83-percent reduction by 2050, both relative to a 2005 baseline, with targets that decline steadily for intermediate years. Compliance is enforced through a requirement for entities subject to the cap to submit allowances, which are bankable, sufficient to cover their emissions. Allowance obligations may also be offset by reductions in domestic emissions of exempted sources, by international offsets, or by emission allowances from other countries with comparable laws limiting emissions. Maximum offsets from domestic and international sources are each capped separately at 1 billion metric tons (BMT) in each year of the program, with the proviso that up to 500 million metric tons (MMT) of the domestic offset cap may be shifted to the international offset cap if the Administrator of the Environmental Protection Agency (EPA) determines that a sufficient supply of domestic offsets is not available. In addition to its centerpiece cap-and-trade program, Title III also includes additional GHG standards, dedicated programs to limit hydrofluorocarbon (HFC) emissions and black carbon, and provisions governing markets in carbon-related derivatives.
Title I contains provisions related to a Federal combined efficiency and renewable electricity standard for electricity sellers, carbon capture and storage technology, performance standards for new coal-fueled power plants, research and development support for electric vehicles, support for deployment of a smart grid, and establishment of a Clean Energy Deployment Administration. Title II includes provisions related to building, lighting, appliance, and vehicle energy efficiency programs. Title IV includes provisions to preserve domestic competitiveness and support workers, provide assistance to consumers, and support domestic and international adaptation initiatives. Title V addresses the role of domestic agricultural and forestry-related offsets in the Title III cap-and-trade program.
This report considers the energy-related provisions in ACESA that can be analyzed using EIA’s National Energy Modeling System (NEMS). The Reference Case used as the starting point for the analysis in this report is an updated version of the Annual Energy Outlook 2009 (AEO2009) Reference Case issued in April 2009 that reflects the projected impacts of the American Recovery and Reinvestment Act as well as other significant energy legislation, including the Energy Improvement and Extension Act of 2008, the Energy Independence and Security Act of 2007, and
the Energy Policy Act of 20052. Cumulative GHG emissions covered by the Title III cap-and-trade program over the 2012 to 2030 period are estimated to be 113.4 BMT in CO2-equivalent terms.
Key provisions of ACESA that are represented in the policy cases developed in this analysis include3:
- the GHG cap-and-trade program for gases other than HFCs, including provisions for the allocation of allowances to electricity and natural gas distribution utilities, low-income consumers, State efficiency programs, rebate programs, energy-intensive industries, and other specified purposes;
- the combined efficiency and renewable electricity standard for electricity sellers;
- the carbon capture and storage (CCS) demonstration and early deployment program;
- Federal building code updates for both residential and commercial buildings;
- Federal efficiency standards for lighting and other appliances;
- technology improvements driven by the Centers for Energy and Environmental Knowledge and Outreach; and
- the smart grid peak savings program.
While this analysis is as comprehensive as possible given its timing, it does not address all the provisions of ACESA. Provisions that are not represented include the Clean Energy Deployment Administration, the strategic allowance reserve, the separate cap-and-trade program for HFC emissions, the GHG performance standards for activities not subject to the cap-and-trade program, the distribution of allowances to coal merchant plants, new efficiency standards for transportation equipment, and the effects of increased investment in energy research and development. Of these provisions, the Clean Energy Deployment Administration may have the most significant potential to alter the reported results.
Like other EIA analyses of energy and environmental policy proposals, this report focuses on the impacts of those proposals on energy choices made by consumers in all sectors and the implications of those decisions for the economy. This focus is consistent with EIA’s statutory mission and expertise. The study does not account for any possible health or environmental benefits that might be associated with curtailing GHG emissions.
Finally, while the emissions caps in the ACESA cap-and-trade program decline through the year 2050, the modeling horizon in this report runs only through 2030, the projection limit of NEMS. As in EIA analyses of earlier cap-and-trade proposals, the need to pursue higher-cost emissions reductions beyond 2030, driven by tighter caps and continued economic and population growth, can be reflected in the modeling by assuming that a positive bank of allowances is held at the end of 2030 in all but one case.
Analysis Cases
EIA prepared a range of analysis cases for this report. The six main analysis cases discussed in this Executive Summary, while not exhaustive, focus on two key areas of uncertainty that impact the analysis results.
The role of offsets is a large area of uncertainty in any analysis of ACESA. The 2-BMT annual limit on total offsets in ACESA is equivalent to one-third of total energy-related GHG emissions in 2008 and represents nearly six times the projected growth in energy-related emissions through 2030 in the Reference Case used in this analysis.
While the ceiling on offset use is clear, their actual use is an open question. Beyond the usual uncertainties related to the technical, economic, and market supply of offsets, the future use of offsets for ACESA compliance also depends both on regulatory decisions that are yet to be made by the EPA, on the timing and scope of negotiations on international agreements or arrangements between the United States and countries where offset opportunities may exist, and on emissions reduction commitments made by other countries. Also, limits on offset use in ACESA apply individually to each covered entity, so that offset “capacity” that goes unused by one or more covered entities cannot be used by other covered entities. For some major entities covered by the cap-and-trade program, decisions regarding the use of offsets could potentially be affected by regulation at the State level. Given the many technical factors and implementation decisions involved, it is hardly surprising that analysts’ estimates of international offset use span an extremely wide range. One recent analysis doubts that even 150 MMT of international offsets will be used by 2020, while another posits that 1 BMT of international offsets will be used almost immediately from the start of the program in 2012, followed by a quick rise towards an expanded 1.5-BMT ceiling shortly thereafter.
The other major area of uncertainty in assessing the energy system and economic impacts of ACESA involves the timing, cost, and public acceptance of low- and no-carbon technologies. For the period prior to 2030, the availability and cost of low- and no-carbon baseload electricity technologies, such as nuclear power and fossil (coal and natural gas) with CCS, which can potentially displace a large amount of conventional coal-fired generation, is a key issue. However, technology availability over an extended horizon is a two-sided issue. Research and development breakthroughs over the next two decades could expand the set of reasonably priced and scalable low- and no-carbon energy technologies across all energy uses, including transportation, with opportunities for widespread deployment beyond 2030. The achievement of significant near-term progress towards such an outcome, however, could significantly reduce the size of the bank of allowances that covered entities and other market participants would want to carry forward to meet compliance requirements beyond 2030.
With these key uncertainties in mind, the main analysis cases discussed in this report are as follows:
- The ACESA Basic Case represents an environment where key low-emissions technologies, including nuclear, fossil with CCS, and various renewables, are developed and deployed on a large scale in a timeframe consistent with the emissions reduction requirements of ACESA without encountering any major obstacles. It also assumes that the use of offsets, both domestic and international, is not severely constrained by cost, regulation, or the pace of negotiations with key countries covering key sectors. In anticipation of increasingly stringent caps and rising allowance prices after 2030, covered entities and investors are assumed to amass an aggregate allowance bank of approximately 13 BMT by 2030 through a combination of offset usage and emission reductions that exceed the level required under the emission caps.
- The ACESA Zero Bank Case is similar to the Basic Case except that no banked allowances are held in 2030, reflecting the assumed availability of a broad array of reasonably priced low- and no-carbon technologies that can provide an alternative path to compliance with tighter emissions caps after 2030 through reductions across all energy uses, including transportation.
- The ACESA High Offsets Case is similar to the Basic Case except that it assumes the near-immediate use of international offsets at levels at or close to the specified aggregate ceiling, without regard to possible institutional or market impediments.
- The ACESA High Cost Case is similar to the Basic Case except that the costs of nuclear, coal with CCS, and dedicated biomass generating technologies are assumed to be 50 percent higher.
- The ACESA No International Case is similar to the Basic Case, but represents an environment where the use of international offsets is severely limited by cost, regulation, and/or slow progress in reaching international agreements or arrangements covering offsets in key countries and sectors.
- The ACESA No International/Limited Case combines the treatment of offsets in the ACESA No International Case with an assumption that deployment of key technologies, including nuclear, fossil with CCS, and dedicated biomass, cannot expand beyond their Reference Case levels through 2030.4
The full report discusses a number of additional analysis cases, including an accelerated Corporate Average Fuel Efficiency (CAFE) standards (35CAFE2016) case that incorporates the acceleration in fuel economy standards for light-duty vehicles announced by the Administration in May 2009, a 5-percent discount case that adopts an alternative view of real escalation in allowance prices (Low Discount), a case with limitations to the penetration of nuclear, CCS, and biomass gasification capacity (Limited Alternatives), an accelerated energy technology (High Tech) case, and a higher level of allowance banking (High Banking) case.
EIA cannot attach probabilities to the individual policy cases. However, both theory and common sense suggest that cases that reflect an unbroken chain of either failures or successes in a series of independent factors are inherently less likely than cases that do not assume that everything goes either wrong or right. In this respect, the No International/Limited and Zero Bank Cases might be viewed as more pessimistic and optimistic scenarios, respectively, which bracket a set of more likely cases. Similarly, if actual access to international offsets is dependent on a series of independent regulatory and negotiating outcomes, cases with intermediate access to international offsets might be viewed as more likely than those representing either complete and immediate success across the board (High Offsets), or a permanent lack of progress (No International) in such activities.
Key Findings
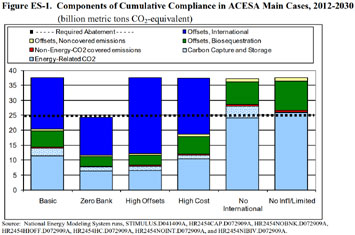
Given the potential of offsets as a low-cost compliance option, the amount of reduction in covered emissions is exceeded by the amount of compliance generated through offsets in most of the main analysis cases (Figure ES-1). Cumulative compliance between 2012 and 2030, including reductions both in domestic emissions of covered gases and in domestic and international offsets, ranges from 24.4 BMT to 37.6 BMT carbon dioxide (CO2)-equivalent emissions in the main analysis cases, representing a 21-percent to 33-percent reduction from the level of cumulative covered emissions projected in the Reference Case.5 In the ACESA Basic Case, domestic abatement of covered gases represents only 39 percent of cumulative compliance. In the ACESA High Offsets Case, where the maximum quantity of international offsets is used immediately at the start of the program in 2012, domestic abatement in covered gases accounts for just 22 percent of the cumulative compliance. Reductions in the emissions of energy-related CO2 account for more than half of projected cumulative compliance through 2030 only in the cases where international offsets are not assumed to be available.
The vast majority of reductions in energy-related emissions are expected to occur in the electric power sector. Across the ACESA main cases, the electricity sector accounts for between 80 percent and 88 percent of the total reduction in energy-related CO2 emissions relative to the Reference Case in 2030. Reductions in electricity-sector emissions are primarily achieved by reducing the role of conventional coal-fired generation, which in 2007 provided 50 percent of total U.S. generation, and increasing the use of no- or low-carbon generation technologies that either exist today (e.g. renewables and nuclear) or are under development (fossil with CCS). In addition, a portion of the electricity-related CO2 emissions reductions results from reduced electricity demand stimulated both by consumer responses to higher electricity prices and incentives in ACESA to stimulate greater efficiency in energy use.
If new nuclear, renewable, and fossil plants with CCS are not developed and deployed in a timeframe consistent with emissions reduction requirements under ACESA, covered entities are expected to respond by increasing their use of offsets, if available, and by turning to increased natural gas use to offset reductions in coal generation. While natural gas generation is expected to fall below the Reference Case level in most ACESA Cases, in the ACESA No International/Limited Case natural gas generation is 68 percent above the Reference Case level by 2030, due to the assumed limited availability of international offsets, new plants with CCS, as well as new nuclear and dedicated biomass capacity (Table ES-1).
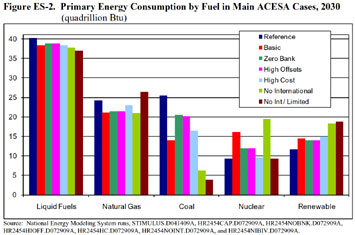
Emissions reductions from changes in fossil fuel use in the residential, commercial, industrial and transportation sectors are small relative to those in the electric power sector. Taken together, changes in fossil fuel use in these sectors account for between 12 percent and 20 percent of the total reduction in energy-related CO2 emissions relative to the Reference Case in 2030, reflecting both lesser percentage changes in delivered fossil fuel prices than experienced by the electricity generation sector and the low availability of alternatives in many applications (Figure ES-2). For example, motor gasoline prices in the ACESA Basic Case are only 20 cents per gallon higher than in the Reference Case in 2020 and 35 cents per gallon higher in 2030 (in 2007 dollars). In addition, since all cases include the 35-mile-per-gallon CAFE standard enacted in the Energy Independence and Security Act of 2007, many of the most cost-effective vehicle efficiency options are adopted in all cases, including the Reference Case. Beyond reductions in direct fuel use, the reduction in electricity demand, which ranges from 4.1 percent to 14.7 percent below the Reference Case level in 2030 across the main policy cases, makes an important contribution to the overall reduction in electricity-related emissions.
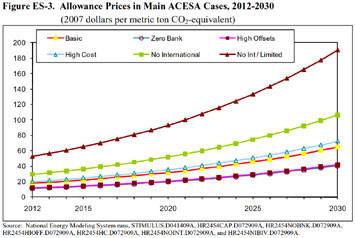
GHG allowance prices are sensitive to the cost and availability of emissions offsets and low-and no-carbon generating technologies. Allowance prices in the ACESA Basic Case are projected at $32 per metric ton in 2020 and $65 per metric ton in 2030. Across all main analysis cases, allowance prices range from $20 to $93 per metric ton in 2020 and from $41 to $191 (2007 dollars) per metric ton in 2030 (Figure ES-3). The lower prices in the range occur in cases where technological options such as CCS and adoption of new nuclear power plants can be deployed on a large scale before 2030 at relatively low costs, the use of international offsets helps to hold down compliance costs, and/or optimism about future technology availability holds down the near-term incentive to bank allowances for use beyond 2030 (ACESA Basic, ACESA High Offset, and/or ACESA Zero Bank cases). Higher allowance prices occur if international offsets are unavailable, particularly if it is also the case that low- or no-emission baseload electricity supply technologies cannot be expanded beyond the Reference Case level (ACESA No International and ACESA No International/Limited cases).
ACESA increases energy prices, but effects on electricity and natural gas bills of consumers are substantially mitigated through 2025 by the allocation of free allowances to regulated electricity and natural gas distribution companies. Except for the ACESA No International/Limited Case, electricity prices in five of the six main ACESA cases range from 9.5 to 9.6 cents per kilowatthour in 2020, only 3 to 4 percent above the Reference Case level.6 Average impacts on electricity prices in 2030 are projected to be substantially greater, reflecting both higher allowance prices and the phase-out of the free allocation of allowances to distributors between 2025 and 2030. By 2030, electricity prices in the ACESA Basic Case are 12.0 cents per kilowatthour, 19 percent above the Reference Case level, with a wider band of 11.1 cents to 17.8 cents (10 to 77 percent above the Reference Case level) across all six main policy cases.
ACESA increases the cost of using energy, which reduces real economic output, reduces purchasing power, and lowers aggregate demand for goods and services. The result is that projected real gross domestic product (GDP) generally falls relative to the Reference Case. Total discounted GDP losses over the 2012 to 2030 time period are $566 billion (-0.3 percent) in the ACESA Basic Case, with a range from $432 billion (-0.2 percent) to $1,897 billion (-0.9 percent) across the main ACESA cases (Table ES-2). Similarly, the cumulative discounted losses for personal consumption are $273 billion (-0.2 percent) in the ACESA Basic Case and range from $196 billion (-0.1 percent) to $988 billion (-0.7 percent). GDP losses in 2030, the last year explicitly modeled in this analysis, range from $104 billion to $453 billion (-0.5 to -2.3 percent), while consumption losses in that year range from $36 billion to $180 billion (-0.3 to -1.3 percent). The estimated 2030 GDP and consumption losses in the ACESA No International/Limited Case, at the top of these ranges, are nearly or more than twice as large as those in the ACESA No International and High Cost Cases, which have the next highest level of impacts.
Consumption and energy bill impacts can also be expressed on a per household basis in particular years. In 2020, the reduction in household consumption is $134 (2007 dollars) in the ACESA Basic Case, with a range of $30 to $362 across all main ACESA cases. In 2030, household consumption is reduced by $339 in the ACESA Basic Case, with a range of $157 to $850 per household across all main ACESA cases. By 2030, the estimated reductions in household consumption in the ACESA No International/Limited Case, at the top of these ranges, are approximately double the impacts in the ACESA High Cost Case, which has the next highest level of impacts.
The free allocation of output-based allowances reduces the impact of ACESA on energy-intensive, trade- vulnerable industries. Receiving free allowances in proportion to output softens the impacts of increased energy prices on these industries. As a result, when energy prices increase under ACESA, the reductions in output of these trade- and energy-vulnerable industries are less than overall manufacturing impacts and mirror the impacts of total industrial shipments. The discounted cumulative percent losses of energy-intensive industrial output range from -0.5 percent to -3.6 percent from 2012-2030 compared to manufacturing losses of -0.5 percent to -4.3 percent.
Additional Insights
The role of baseline assumptions. The choice of a baseline is one of the most influential assumptions for any analysis of global climate change legislation. This analysis uses the updated Reference Case of the AEO2009 as a starting point. These projections and our analysis are not meant to be exact predictions of the future but represent plausible energy futures given technological and demographic trends, current laws and regulations, and consumer behavior as derived from available data. EIA recognizes that projections of energy markets over a nearly 25-year period are highly uncertain and subject to many events that cannot be foreseen, such as supply disruptions, policy changes, and technological breakthroughs. In addition to these phenomena, long-term trends in technology development, demographics, economic growth, and energy resources may evolve along a different path than expected in the projections. Generally, differences between cases, which are the focus of our report, are likely to be more robust than the specific projections for any one case. The published AEO2009,which includes numerous cases reflecting a variety of alternative futures for the economy, energy markets, and technology, is a resource that can be used to examine the implications of alternative baselines.
The strategic allowance reserve. The strategic allowance reserve, which focuses on the important issue of short-term volatility in allowance prices, is not addressed in this analysis. As currently structured, the strategic allowance reserve, following a startup period, relies on a “trigger price” for auctions that is set in relation to recent allowance prices. Such an approach does not appear to preclude a scenario in which allowance prices evolve along a “high” trajectory given underlying conditions that would support such an outcome, such as those examined in the No International and No International/Limited cases. Also, the strategic allowance reserve, in contrast to other cost-containment mechanisms that more directly tie compliance pressure to the level of compliance costs or other measures of economic impact, would be unlikely to discourage stakeholders who view GHG emissions limitation as the highest environmental protection priority from pursuing efforts to block the deployment of nuclear power, CCS, or other technologies that, from their perspective, may raise important, but lesser, concerns. Therefore, as discussed in earlier EIA analyses, decisions regarding the design of a cost-containment mechanism can affect the public acceptance of key low- and no-carbon technologies that may be part of a cost-effective compliance mix.
Free allowance allocation to electricity and natural gas distributors. The analysis shows that the free allocation of allowances to electricity and natural gas distributors significantly ameliorates impacts on consumer electricity and natural gas prices prior to 2025, when it starts to be phased out. While this result may serve goals related to regional and overall fairness of the program, the overall efficiency of the cap-and-trade program is reduced to the extent that the price signal that would encourage cost-effective changes by consumers in their use of electricity and natural gas is delayed.
Electricity capacity siting challenges. Besides changing the projected mix of new electricity generation capacity, compliance with ACESA will also significantly increase the total amount of new electric capacity that must be added between now and 2030 due to the retirement of many existing coal-fired power plants that otherwise would be expected to continue operating beyond 2030. Obstacles to siting major electricity generation projects and/or the transmission facilities needed to support the greatly expanded use of renewable energy sources are not explicitly considered in this report. However, the additional capacity needs in all of the ACESA cases suggest the need for review of siting processes so that they will be able to support a large-scale transformation of the Nation’s electricity infrastructure by 2030.
Challenges beyond 2030. As previously noted, the modeling horizon for this analysis ends in 2030. Unless substantial progress is made in identifying low- and no-carbon technologies outside of electricity generation, the ACESA emissions targets for the 2030-to-2050 period are likely to be very challenging as opportunities for further reductions in power sector emissions are exhausted and reductions in other sectors are thought to be more expensive.
Notes |