Released on July 8, 2010
(Next Release on July 14, 2010)
The Ethanol Blend Wall
Fuel ethanol is a renewable fuel made from grain or other biomass sources that is blended into motor gasoline. Ethanol blending into gasoline in the United States has been rising strongly since 2002, initially driven by action taken in several States to ban the use of methyl tertiary butyl ether (MTBE), a competing gasoline additive. At the Federal level, the Energy Policy Act of 2005 (EPACT2005) made changes in the requirements for reformulated gasoline that precipitated a Nation-wide phase out of MTBE beginning in 2006. Soon thereafter, the Energy Independence and Security Act of 2007 (EISA) further boosted fuel ethanol demand by accelerating and extending the federal Renewable Fuel Standard (RFS) program that was first established by EPACT2005. The revised RFS requires the use of about 15.2 billion gallons of renewable fuel by 2012 and 36 billion gallons by 2022. EIA expects that 13.2 billion gallons of the 2012 requirement will be met using corn-based fuel ethanol.
Under current Federal regulations, ethanol blends of up to 10 percent (E10) may be sold for use in all gasoline-powered vehicles. E85, a fuel blend with 70 percent to 85 percent ethanol content, may also be sold, but only for use in vehicles that have been specifically designed to accommodate E85. To date, however, E85 is presently consumed in very limited volumes (5,644 barrels per day (bbl/d) in 2008) with only about 1,900 E85 pumps nationwide in 2009, and it is not expected to show significant growth over the short term.
In an environment where nearly all fuel ethanol is sold as E10, saturation of the E10 market creates a barrier to accommodating additional ethanol supply, commonly referred to as the “blend wall”. During April 2010 an estimated 834,000 bbl/d (12.8 billion gallons per year [BGY]) of fuel ethanol was blended into gasoline, representing an average 9.2 percent of total gasoline product supplied by volume. The July EIA Short-Term Energy Outlook projects that the ethanol share of the gasoline pool could reach 10 percent in the first quarter next year when total gasoline consumption is expected to average about 8.8 million bbl/d (135 BGY).
There are 4 primary factors that will influence the ethanol blend wall constraint:
| 1. E10 sales volume |
| 2. E85 sales volume |
| 3. Ethanol-blending infrastructure constraints that limit the ability to blend and deliver E10 and E85 to local markets |
| 4. Possible relaxation of the 10 percent ethanol blending limit on fuels used in vehicles not specifically designed to accommodate E85. |
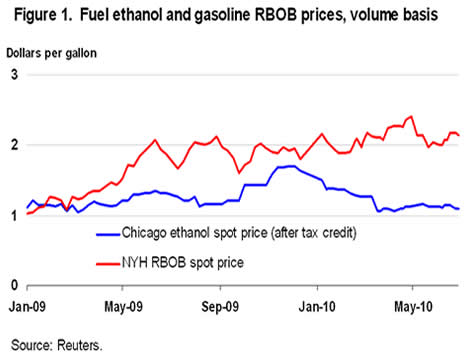
Absent a relaxation of the 10 percent limit on ethanol blending in the general gasoline pool, and with still increasing ethanol production capacity, there will likely be downward pressure on ethanol prices as the blend wall is approached, which could contribute to an increase in E85 sales within the constraints of its limited infrastructure, an increase in ethanol exports, and lower capacity utilization rates. Over the past year, and especially at the start of 2010, the ethanol price (after deducting the 45 cents per gallon ethanol blender’s excise tax credit) has remained at a discount to reformulated gasoline blendstock for oxygenate blending (RBOB) (Figure 1).
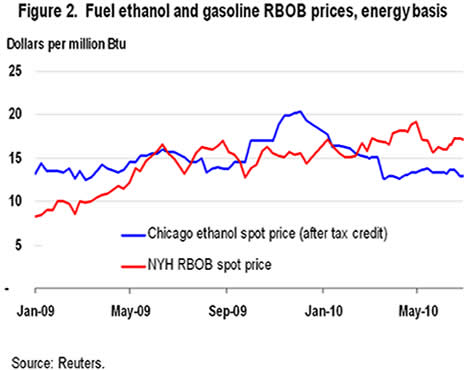
Over the next few years, as the E10 market becomes saturated, the E85 market may become the marginal outlet for additional ethanol supply and ethanol prices may move towards an energy-equivalent basis, or lower, relative to RBOB (Figure 2). The gross energy content of fuel ethanol is about 85,000 Btu/gal, or 32 percent lower, compared with about 125,000 Btu per gallon for RBOB. While the lower energy content of E10 gasoline containing ethanol relative to gasoline not blended with ethanol is generally too small to be noticed by most consumers, the fuel economy differences between E85 and gasoline are more readily observable and will likely necessitate a price discount to encourage consumption.
How low ethanol prices may go to stimulate demand will be influenced by the cost of ethanol production and the fate of the ethanol blender’s tax credit. Unlike the price spikes in 2008, very high corn yields over the past year have kept corn prices low, allowing input costs to remain consistently low despite an increasing level of ethanol output (see “Fuel Ethanol Margins: 2009 Update,” This Week in Petroleum Jan. 21, 2010). A significant increase in corn prices could lead to a reduction of supply and delay the timing of reaching the blend wall. On the other hand, the ethanol blender’s tax credit of 45 cents for every gallon of ethanol blended (4.5 cents for every gallon of E10 and 38.25 cents per gallon of E85) tends to support increased ethanol use and lower ethanol prices. The fate of this tax credit, which is currently set to expire at the end of 2010, will also impact ethanol pricing and gasoline blending economics.
As the RFS mandate increases, the pricing of Renewable Identification Numbers (RINs) could also play an important role. Under the RFS, each gallon of biofuel is assigned a RIN. Obligated parties must hold mandated levels of RINs either through their direct use of biofuels or by purchasing RINs from the market. Constraints on outlets for ethanol would tend to raise the demand for RINs, and thereby raise their price. Higher RINs prices would, in turn, encourage the search for additional domestic outlets for ethanol in order to meet the RFS mandate levels.
Tight distribution channels, lack of E85 infrastructure, and limited flex-fuel vehicle sales necessary for widespread E85 consumption could also encourage ethanol exports to other markets such as Canada, Europe, or India.
The blend wall is an important event moving forward for the ethanol industry. As the EPA recently delayed its decision on allowing an E15 blend until sometime this fall, ethanol prices might be expected to continue their recent trend given expected production levels, although an increase in gasoline consumption in the summer months could absorb additional ethanol and help support prices.
Gasoline and Diesel Prices Fall Over 3 Cents
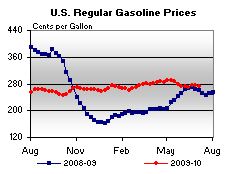
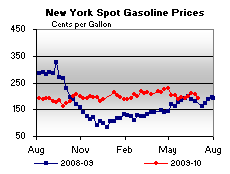
Dropping for the first time in three weeks, the U.S. average price for regular gasoline fell three cents to $2.73 per gallon. The national average was $0.11 higher than last year. Regionally, average prices slipped in all sections of the country. The averages on the East Coast and on the Gulf Coast dropped about three cents each to $2.67 per gallon and $2.58 per gallon, respectively. The largest drop took place in the Midwest where the average slumped more than a nickel to $2.68 per gallon. The average in the Rocky Mountains declined a penny to $2.76 per gallon. The West Coast price slipped half a cent to settle at $3.05 per gallon and the average in California fell a penny to $3.12 per gallon.
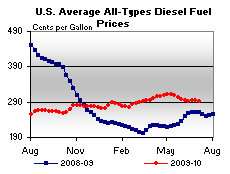
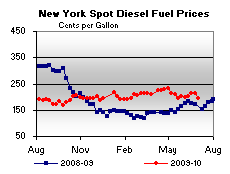
The national average price for diesel fuel declined more than three cents to $2.92 per gallon, $0.33 above the price a year ago. All regions registered price decreases. The East Coast fell over three cents to $2.94 per gallon while the Gulf Coast decreased almost three cents to $2.87 per gallon. The largest decline took place in the Midwest where the average fell four cents to $2.89 per gallon. The Rocky Mountain price was nearly three cents lower at $2.93 per gallon. The average on the West Coast slipped two cents to $3.08 per gallon while the price in California dipped 1.5 cents to $3.13 per gallon.
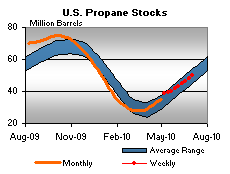
Propane Stocks Continue to Gain
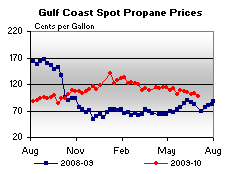
U.S. inventories of propane continued their seasonal build last week as total stocks added 1.9 million barrels to end at 49.7 million barrels. The Midwest region saw most of the build with 1.5 million barrels of new propane stocks. The Gulf Coast regional inventories grew by 0.2 million barrels, while the Rocky Mountain/West Coast region grew by 0.1 million barrels. The East Coast regional stocks were down slightly.
Text from the previous editions of “This Week In Petroleum” is accessible through a link at the top right-hand corner of this page.
| Retail Prices (Cents Per Gallon) | |||||||
 |
 |
||||||
| Retail Data | Changes From | Retail Data | Changes From | ||||
| 07/05/10 | Week | Year | 07/05/10 | Week | Year | ||
| Gasoline | 272.6 | Diesel Fuel | 292.4 | ||||
| Spot Prices (Cents Per Gallon*) | |||||||||||||||||||||||||||||||||||
 |
 |
||||||||||||||||||||||||||||||||||
 |
 |
||||||||||||||||||||||||||||||||||
|
 |
||||||||||||||||||||||||||||||||||
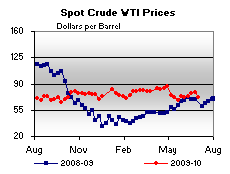
| *Note: Crude Oil WTI Price in Dollars per Barrel. | |||||||||||||||||||||||||||||||||||
| Stocks (Million Barrels) | |||||||
 |
 |
||||||
 |
 |
||||||
| Stocks Data | Changes From | Stocks Data | Changes From | ||||
| 07/02/10 | Week | Year | 07/02/10 | Week | Year | ||
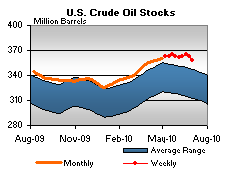
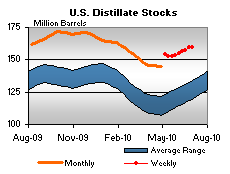
| Crude Oil | 358.2 | Distillate | 159.7 | ||||
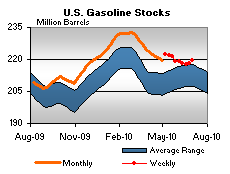
| Gasoline | 219.4 | Propane | 49.724 | ||||