|
Download Data (XLS File) |
|
||||||||||||
|
||||||||||||
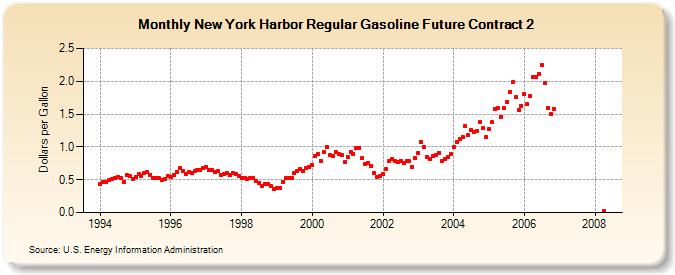
| New York Harbor Regular Gasoline Future Contract 2 (Dollars per Gallon) | ||||||||||||
| Year | Jan | Feb | Mar | Apr | May | Jun | Jul | Aug | Sep | Oct | Nov | Dec |
|---|---|---|---|---|---|---|---|---|---|---|---|---|
| 1994 | 0.437 | 0.458 | 0.461 | 0.498 | 0.514 | 0.532 | 0.549 | 0.526 | 0.462 | 0.569 | 0.555 | 0.517 |
| 1995 | 0.547 | 0.585 | 0.561 | 0.607 | 0.618 | 0.574 | 0.526 | 0.529 | 0.529 | 0.494 | 0.515 | 0.556 |
| 1996 | 0.545 | 0.575 | 0.619 | 0.684 | 0.635 | 0.589 | 0.612 | 0.609 | 0.626 | 0.655 | 0.642 | 0.681 |
| 1997 | 0.691 | 0.655 | 0.648 | 0.611 | 0.627 | 0.572 | 0.588 | 0.604 | 0.574 | 0.600 | 0.589 | 0.559 |
| 1998 | 0.522 | 0.532 | 0.504 | 0.522 | 0.522 | 0.483 | 0.454 | 0.412 | 0.442 | 0.442 | 0.404 | 0.359 |
| 1999 | 0.375 | 0.380 | 0.466 | 0.528 | 0.521 | 0.523 | 0.600 | 0.627 | 0.666 | 0.631 | 0.680 | 0.697 |
| 2000 | 0.729 | 0.859 | 0.891 | 0.789 | 0.917 | 0.995 | 0.878 | 0.858 | 0.917 | 0.886 | 0.877 | 0.768 |
| 2001 | 0.841 | 0.919 | 0.889 | 0.988 | 0.983 | 0.825 | 0.736 | 0.753 | 0.716 | 0.605 | 0.547 | 0.558 |
| 2002 | 0.586 | 0.661 | 0.792 | 0.812 | 0.787 | 0.769 | 0.786 | 0.760 | 0.790 | 0.780 | 0.700 | 0.827 |
| 2003 | 0.906 | 1.074 | 1.005 | 0.843 | 0.821 | 0.857 | 0.880 | 0.907 | 0.788 | 0.823 | 0.844 | 0.894 |
| 2004 | 0.992 | 1.075 | 1.118 | 1.151 | 1.311 | 1.177 | 1.261 | 1.233 | 1.248 | 1.380 | 1.287 | 1.150 |
| 2005 | 1.275 | 1.373 | 1.571 | 1.597 | 1.461 | 1.589 | 1.683 | 1.840 | 1.982 | 1.755 | 1.562 | 1.629 |
| 2006 | 1.807 | 1.653 | 1.781 | 2.067 | 2.069 | 2.114 | 2.249 | 1.973 | 1.594 | 1.508 | 1.577 | |
| 2008 | 0.017 | |||||||||||
| - = No Data Reported; -- = Not Applicable; NA = Not Available; W = Withheld to avoid disclosure of individual company data. |
| Release Date: 4/24/2024 |
| Next Release Date: 5/1/2024 |
Referring Pages: