|
Download Data (XLS File) |
|
|||||
|
|||||
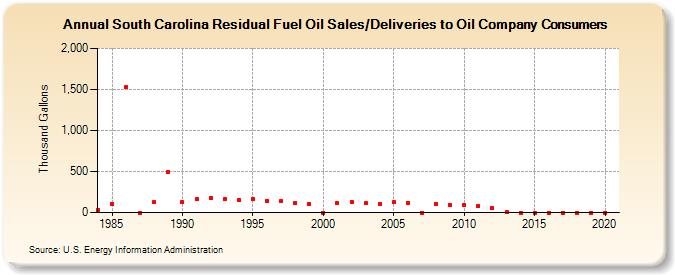
| South Carolina Residual Fuel Oil Sales/Deliveries to Oil Company Consumers (Thousand Gallons) | |||||
| Decade | Year-0 | Year-1 | Year-2 | Year-3 | Year-4 | Year-5 | Year-6 | Year-7 | Year-8 | Year-9 |
|---|---|---|---|---|---|---|---|---|---|---|
| 1980's | 31 | 107 | 1,524 | 0 | 123 | 496 | ||||
| 1990's | 127 | 160 | 177 | 164 | 154 | 168 | 144 | 141 | 120 | 109 |
| 2000's | 0 | 111 | 132 | 113 | 110 | 130 | 117 | 0 | 110 | 94 |
| 2010's | 98 | 81 | 54 | 11 | 0 | 0 | 0 | 0 | 0 | 0 |
| 2020's | 0 |
| - = No Data Reported; -- = Not Applicable; NA = Not Available; W = Withheld to avoid disclosure of individual company data. |
| Release Date: 2/9/2022 |
| Next Release Date: Suspended |