|
Download Data (XLS File) |
|
|||||
|
|||||
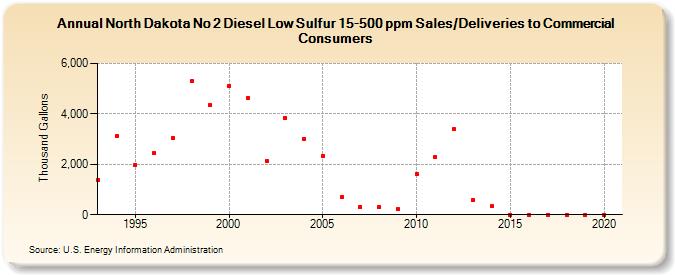
| North Dakota No 2 Diesel Low Sulfur 15-500 ppm Sales/Deliveries to Commercial Consumers (Thousand Gallons) | |||||
| Decade | Year-0 | Year-1 | Year-2 | Year-3 | Year-4 | Year-5 | Year-6 | Year-7 | Year-8 | Year-9 |
|---|---|---|---|---|---|---|---|---|---|---|
| 1990's | 1,385 | 3,110 | 1,986 | 2,453 | 3,047 | 5,291 | 4,350 | |||
| 2000's | 5,125 | 4,634 | 2,134 | 3,831 | 3,016 | 2,338 | 699 | 309 | 300 | 224 |
| 2010's | 1,624 | 2,288 | 3,387 | 588 | 328 | 6 | 0 | 0 | 0 | 0 |
| 2020's | 0 |
| - = No Data Reported; -- = Not Applicable; NA = Not Available; W = Withheld to avoid disclosure of individual company data. |
| Release Date: 2/9/2022 |
| Next Release Date: Suspended |