|
Download Data (XLS File) |
|
|||||
|
|||||
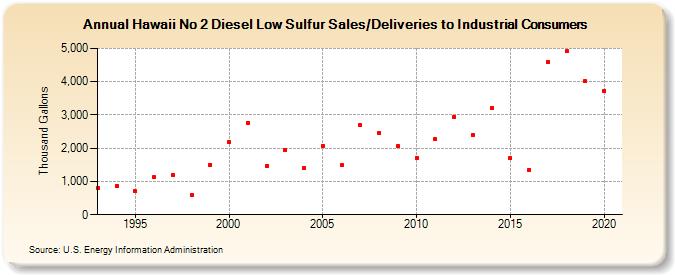
| Hawaii No 2 Diesel Low Sulfur Sales/Deliveries to Industrial Consumers (Thousand Gallons) | |||||
| Decade | Year-0 | Year-1 | Year-2 | Year-3 | Year-4 | Year-5 | Year-6 | Year-7 | Year-8 | Year-9 |
|---|---|---|---|---|---|---|---|---|---|---|
| 1990's | 807 | 873 | 705 | 1,125 | 1,203 | 590 | 1,502 | |||
| 2000's | 2,178 | 2,761 | 1,477 | 1,958 | 1,402 | 2,078 | 1,480 | 2,689 | 2,462 | 2,071 |
| 2010's | 1,715 | 2,276 | 2,952 | 2,404 | 3,207 | 1,702 | 1,356 | 4,591 | 4,910 | 4,012 |
| 2020's | 3,727 |
| - = No Data Reported; -- = Not Applicable; NA = Not Available; W = Withheld to avoid disclosure of individual company data. |
| Release Date: 2/9/2022 |
| Next Release Date: Suspended |