|
Download Data (XLS File) |
|
|||||
|
|||||
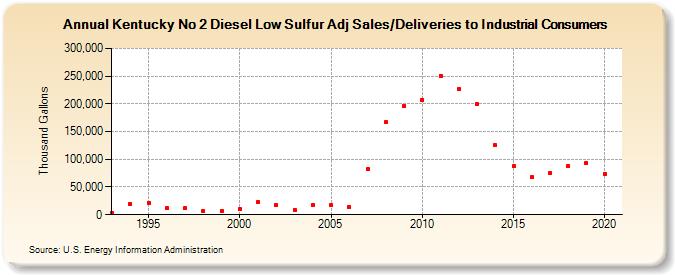
| Kentucky No 2 Diesel Low Sulfur Adj Sales/Deliveries to Industrial Consumers (Thousand Gallons) | |||||
| Decade | Year-0 | Year-1 | Year-2 | Year-3 | Year-4 | Year-5 | Year-6 | Year-7 | Year-8 | Year-9 |
|---|---|---|---|---|---|---|---|---|---|---|
| 1990's | 2,308 | 19,922 | 21,215 | 12,106 | 11,419 | 6,385 | 7,238 | |||
| 2000's | 9,787 | 22,506 | 17,504 | 8,437 | 16,865 | 17,951 | 14,017 | 81,952 | 166,748 | 195,985 |
| 2010's | 207,513 | 250,352 | 226,172 | 199,184 | 125,589 | 87,088 | 67,337 | 74,874 | 87,110 | 93,237 |
| 2020's | 74,034 |
| - = No Data Reported; -- = Not Applicable; NA = Not Available; W = Withheld to avoid disclosure of individual company data. |
| Release Date: 2/9/2022 |
| Next Release Date: Suspended |