|
Download Data (XLS File) |
|
|||||
|
|||||
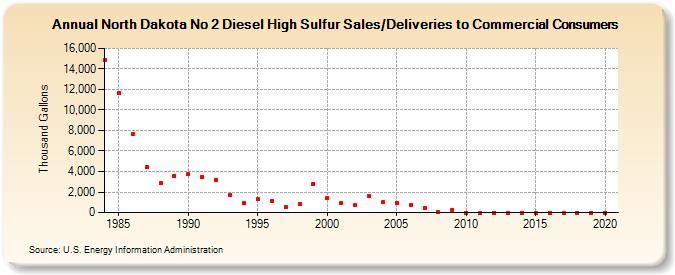
| North Dakota No 2 Diesel High Sulfur Sales/Deliveries to Commercial Consumers (Thousand Gallons) | |||||
| Decade | Year-0 | Year-1 | Year-2 | Year-3 | Year-4 | Year-5 | Year-6 | Year-7 | Year-8 | Year-9 |
|---|---|---|---|---|---|---|---|---|---|---|
| 1980's | 14,854 | 11,645 | 7,686 | 4,425 | 2,844 | 3,588 | ||||
| 1990's | 3,721 | 3,495 | 3,208 | 1,752 | 960 | 1,287 | 1,093 | 548 | 856 | 2,829 |
| 2000's | 1,426 | 918 | 697 | 1,646 | 985 | 959 | 754 | 459 | 14 | 274 |
| 2010's | 0 | 0 | 0 | 0 | 0 | 0 | 0 | 0 | 0 | 0 |
| 2020's | 0 |
| - = No Data Reported; -- = Not Applicable; NA = Not Available; W = Withheld to avoid disclosure of individual company data. |
| Release Date: 2/9/2022 |
| Next Release Date: Suspended |