|
Download Data (XLS File) |
|
|||||
|
|||||
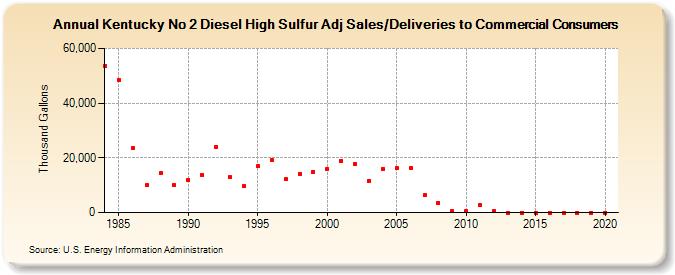
| Kentucky No 2 Diesel High Sulfur Adj Sales/Deliveries to Commercial Consumers (Thousand Gallons) | |||||
| Decade | Year-0 | Year-1 | Year-2 | Year-3 | Year-4 | Year-5 | Year-6 | Year-7 | Year-8 | Year-9 |
|---|---|---|---|---|---|---|---|---|---|---|
| 1980's | 53,597 | 48,454 | 23,479 | 9,977 | 14,325 | 10,013 | ||||
| 1990's | 11,906 | 13,875 | 24,072 | 12,980 | 9,532 | 16,864 | 19,058 | 12,092 | 14,263 | 14,836 |
| 2000's | 15,962 | 18,947 | 17,761 | 11,703 | 15,953 | 16,116 | 16,394 | 6,248 | 3,658 | 527 |
| 2010's | 562 | 2,765 | 641 | 0 | 0 | 0 | 0 | 0 | 0 | 0 |
| 2020's | 0 |
| - = No Data Reported; -- = Not Applicable; NA = Not Available; W = Withheld to avoid disclosure of individual company data. |
| Release Date: 2/9/2022 |
| Next Release Date: Suspended |